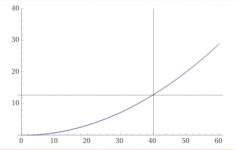
This is an estimate of your current system curve at "A".
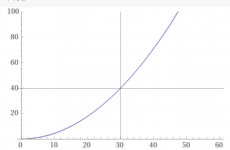
"B" is closer to what it should be.
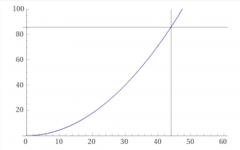
"C" is a really good system.
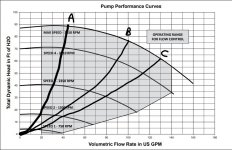
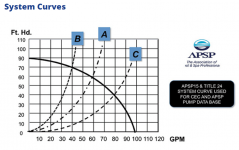
In this graph, Curve A represents 2-inch, Curve B 1.5-inch, and Curve C represents 2.5-inch plumbing networks.
Your system curve matches the 1.5" plumbing curve, which is not good.
"B" is closer to what it should be.
"C" is a really good system.


In this graph, Curve A represents 2-inch, Curve B 1.5-inch, and Curve C represents 2.5-inch plumbing networks.
Your system curve matches the 1.5" plumbing curve, which is not good.
Last edited:


