The Ultimate Thermometer

Dirk

Gold Supporter
TFP Guide
Nov 12, 2017
11,899
Central California
Pool Size
12300
Surface
Plaster
Chlorine
Salt Water Generator
SWG Type
Pentair Intellichlor IC-40
How ultimate? Hey, it’s me!

Since I became a pool owner I’ve been trying to find a good solution for reading both my pool temperature and my outdoor temperature. I’ve been through the obvious ones: floating in the pool, or stuck to a window. But I also had a need for my home automation system (HA) to have those temperatures. I wanted to see my pool’s temp from anywhere in my house and while away, and my HA could do some handy things for me if it had access to reliable indoor and outdoor temps, like turning on/off ceiling fans and citrus tree heaters, alerting me when to close up the house when it gets hot out, etc.

For years I struggled with what I had available: namely my HVAC thermostat, which I can access with my HA, and the local weather report, also available to my HA. But the HVAC was only somewhat accurate, and the local weather was not. It was either off by many degrees, or just unavailable (their server is constantly reporting various errors). I could get at pool temperature through ScreenLogic, but only while the pool’s pump was running, which is as little as four hours a day and never more than 12! And I couldn’t get that temperature reading into my HA software.

So I sniffed around on the ‘net for devices that might work, and found a few. There are digital floating pool thermometers. I could have probably gotten one connected to my HA. And there are all sorts for indoor digital probes that can talk to your computer via wifi or bluetooth. But there was always something missing from these solutions… until I stumbled onto these guys.


I ordered one of their products immediately and got to work. In short order I realized I shouldn’t have gotten their wi-fi solution, so I returned it for one that connects directly to my ethernet LAN. Basically this device can connect to multiple one-wire temperature sensors and then report temperature readings for all of them via a built-in web server. This server can provide a nice looking (and customizable) web page, or raw data in XML format.

So… back up into the attic I go! I figured since I was going up there (again!) I might as well make it worth my while. I ordered a spool of ethernet cable and six temperature sensors. I ran cable from my office (where I installed the Control By Web gizmo) to a junction box in the attic. From there I ran cable to various locations in my house. The one-wire sensors (which are actually three wires?) can be connected in parallel or in a star topology, or any combination. I ran cable from the junction box to four rooms (great room, master bedroom, office and garage) and one outside under an eve.

I eventually also figured out how to get a sensor in the pool (more on that later). So I had six sensors total.

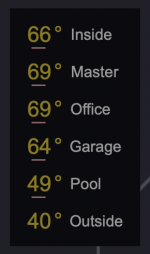
I then programmed by HA software to periodically poll and parse the gizmo for temperature data. I have it polling every 5 minutes and monitoring all six temps. If they change, my HA updates various displays throughout my house. I can get those displays on my computers or iPad or my phone (or any web browser). One section of my HA interface looks like this. The temps get rounded up to the nearest integer:
ha interface 1.png

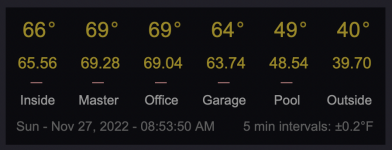
Another version gives me more detail, including the actual temp to two decimal places:
ha interface 2.png

I repurposed an old iPhone 5 and mounted it in a cabinet over the counter in my laundry room where I test my pool water. The same iPhone also has the Pool Math app on it! I installed that 120V outlet just for the phone charger! This cubby is “Pool Central.” My HA software allows me to create these custom screens in any shape and with any info and any touch controls. Brrr, my pool is cold. And the ice cube icon is telling me it’s going to be freezing again tonight.
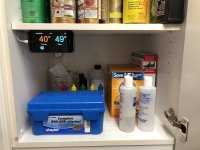
cabinet.jpg

I used my HA software to create the ultimate bedside temperature display, and I run it on my first iPad. As in the original iPad. Credit to the developers of my HA software. Not only did they create something that allows me so much customization, they’re still supporting an app that runs on a 12-year-old iPad!!
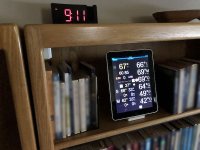
ipad 1.jpg

I could fill a thread with what this display can do. (So I will!) Down the right side are my six sensor readings: Inside (great room), Master bedroom, Office, Garage, Pool and Outside. The upper left area is my HVAC: indoor temperature along with heat and cool thermostat settings. Below that I’ve got sunrise and sunset times for the day, then some HVAC touch controls. Below those is local weather data from NOAA: day-of-the-week initials, high and low temp forecasts plus day and night rain forecasts.

The surrounding spaces are filled with icons that appear for various reasons:
- when my irrigation is running,
- if it’s going to freeze tonight, or later this week,
- if it’s going to rain today or tomorrow or later this week,
- weather advisories,
- HVAC states,
- the state of my garage door,
- if my landline phones are silenced,
- if my iDevices are silenced,
- my Roomba status,
- if I forgot to reconnect my pool vac,
- if my citrus heaters are on (triggered by the outdoor temp sensor)
and a slew of other stuff I might want to know when I’m drifting off or waking up.

I even figured out how to programmatically dim the display for nighttime. It beats the heck out of my old clock that could barely manage outside temp and a little cloud that was supposed to tell me it was going to rain, or something. I dunno, it was always showing a little cloud!

It’s an iPad, so it's also a touchscreen, and I can control all sorts of things:
- HVAC,
- garage door,
- ceiling fans,
- window shade position,
- outdoor speakers,
- small animal defense system,
- phone and iDevice silencing, etc.

I also get any messages or warnings that my HA system is programmed to deliver.

This particular day, for example, it was going to rain, and freeze later at night, there was a weather advisory, the sun was going to set at 6:06pm, my phones were silenced, the small animal defense system was off, and it was going to rain some day this week, and some night this week, and temps would get to freezing at some point this week. Oh, and it was partly cloudy outside (and it was actually partly cloudy outside)!
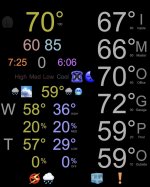
ipad 2.jpg

Ha, I know what you’re thinking, but I’m just getting started!
 
Last edited:
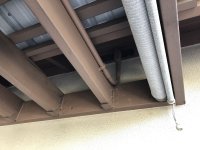
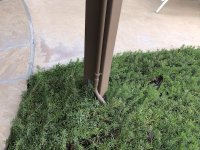
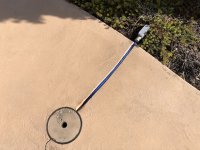
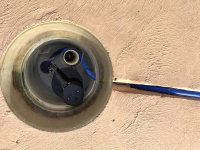
The big challenge (bigger challenge?) was the pool. How to get pool temps into my HA. I probably have the only pool that I could have done this with. I bought another spool of ethernet cable, this time direct burial. I ran it from the attic junction box, across the attic, through a freeze block, under my patio roof, down its post and into the dirt. From there underground, along the edge of my pool deck to a junction box at the nearest spot to my auto-fill well. There just happened to be a concrete groove right where I needed it! I laid a tube in the groove and ran the wire through it Into the well, down to the bottom, through its equalizer tube and into the pool. It’s about 2’ below the surface. Perfect spot for getting pool water temperature.

It’s not ideal in that it sticks out some into the water. Nobody messes with it, but they could. My vac doesn't get near it. I had purchased a water-proof sensor, but when I first tried it I got some strange readings. So I encased it in a plastic sheath and filled that with marine-grade caulk. I let that dry for weeks and so far it’s been rock solid. I’m still experimenting with how far back into the equalizer tube it can live. I don’t want it hanging down into the pool (where it would get the best reading), but too far back into the hole and I think the temperature reading would be affected by the water in the auto-fill well, which could potentially be a different temp than the main pool.

Sidebar: I had originally mounted the outdoor air sensor under an eve near my patio roof. But I was getting weird errant glitches in the air temp readings in the evening. It turned out that the hot air from my BBQ was drifting up, getting caught and distributed by the eve, and fanning out left and right far enough to get to my sensor! So I had to re-run that wire and move the sensor to a better spot. Since then it's been fine. Point being: sensor placement can be critical.

I contend that pools should be built with some sort of niche, similar to a light niche, that connects to a junction box in your yard. The niche would be located mid-pool, mid-depth. This niche could house a temperature sensor, pH and orp sensors, even an under water cam. Whatever gizmo one would want to stuff into it. Seems to me there is a common need for these types of sensors. Maybe someday… I digress.

When I get to redoing my expansion joint, I’ll cover that blue tube with the joint compound and camo it with some sand (like I do the expansion joint). It’ll become invisible. I used the blue tube so that I could later pull the sensor wire out, so I can replace that sensor if it ever goes bad. Just like you would do with a pool light and its cable.

The other five sensors are hidden equally well. From the attic I ran the ethernet cables down the interior walls, and poked through to the various rooms behind picture frames, or wall clocks. They read the air temp perfectly, but can’t be seen. I wired them similarly to the pool, in that the sensors can be easily swapped out should they fail.

Out of the attic and under the patio roof:

patio roof.jpg

Down the post and into the dirt:

patio post.jpg

Up from the dirt and across the deck, into the auto-fill well:

concrete groove.jpg

Down the rabbit hole, into the equalizer tube:

auto fill well.jpg

And out into the pool:

pool sensor.jpg

Yah, that was a lot of trouble, but if it continues to work as it has for all of 2022, I'll be able to check my pool's water temp 24/365/30, from anywhere I happen to be.

Oh, wait, you thought that was it? Come on…
 
Last edited:
  • Like
Reactions: Newdude and JamesW
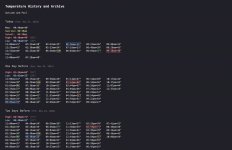
I got inspired to keep track of all this data, seein's how I went to so much trouble to gather it. So I first programmed my HA software to update an HTML webpage (my HA software is also a web server, so it can serve not only my HA control pages (locally and online if I choose), it can also serve any HTML page). The HA software stores 10 days worth of temperature data in local variables. I wrote a python program that parses that stored data to an HTML doc, which gets updated every time any of the temperatures change. I’m only tracking outdoor and pool temps. I could have tracked all six sensors, but I didn’t really need to see that my house is always between 70 and 72 degrees! The original page looked like this:

webpage-1.jpg

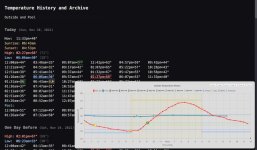
It scrolled to show the current day and the previous ten days. It highlighted, with colored text, sunrise and sunset and various other events, plus listed high and low temps and forecast temps. And while I eventually could make it out well enough, it wasn’t particularly handy. So I foraged the ‘net for a charting solution and found a javascript library that worked great (chart.js). So after much struggling with html and javascript, I could get this:

webpage-2.jpg

I guess this is why they invented charts!! The chart floats over the old webpage version, which I can still scroll to read if I want to. The chart stays in the corner regardless of scrolling. I’ve been improving the chart all year and just finished a slew of upgrades. I’ll probably think of other things to add, but this is what I have so far.

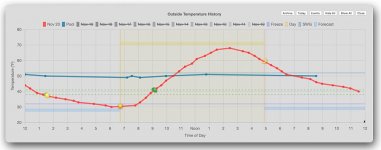
The opening view displays the day’s outdoor (red) and pool (blue) temperatures, plotted over time, in hours. The chart updates when either temperature changes, but not more often than every 20 minutes (user configurable, of course). The yellow shaded area depicts daylight hours, bordered by yellow bands showing sunrise and sunset times. The horizontal aqua line is static at 52°, which is my SWG’s temperature threshold. I can see at a glance there is no SWG for me! The horizontal purple line is 32°. I can see the outdoor air temp in my yard dipped into freezing, when it happened, and when it warmed up. The two dotted green lines are the thresholds at which my citrus tree heaters turn on/off. Small icons get plotted for various events (sunrise, sunset, when my citrus tree heaters go on and off, etc). The little black triangle indicates the time of the last update (midnight in this chart). The horizontal yellow band is the forecasted high, the blue bands are the forecasted lows for each night.

chart-1.jpg

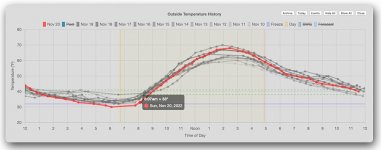
Like the webpage, the chart can display the current day (red) along with the previous ten days (grey). Here, each day is displayed in an array of grey colors that get more transparent the older they are. The chart has a nice popup that shows the details for any data point. Along the top are clickable labels that can turn on/off any data set, and some buttons that display preset views. I can view any day, or any combo of days.

chart-2.jpg

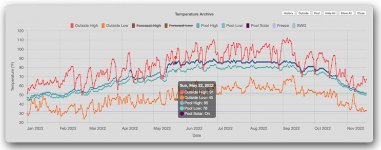
But that’s not all!! I’ve been collecting almost a year’s worth of highs and lows, for both outdoor and pool temps. Oranges are high/low outdoor temps. Blue is for the pool, high and low. The darker blue depicts when my solar heater was on for the day. The popup displays all the temps for any given day I hover over. This chart also has the static lines for the SWG threshold and freezing. I can see at a glance when it’s time to turn the ol’ SWG off for the winter. Also interesting to see how the pool temp is affected by the solar heater and the high and low air temps.

chart-3.jpg

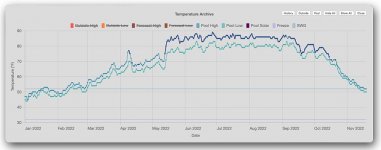
I can use the label controls and buttons to view various data sets, like just the pool and the state of the solar heater. The solar heater state is just a dot when the heater is on for just one day. You can see where I had the heater on for a few random single days here and there in April. But in the summer the heater was on every day and the dots get connected with a line. The popup can show the state of the heater for each individual day (as in the chart above). ScreenLogic can show past temperatures, too, but only when the pump was on, so I can't get high and low temps, like this:

chart-4.jpg

I really lose a lot of heat each night! But it's clear that my solar heater helps keep the pool a bit more cozy. If/when I can get at the ScreenLogic protocol (my next project!), I'll add the heater state to the daily History chart, which will show exactly when the heater turns on/off throughout the day.

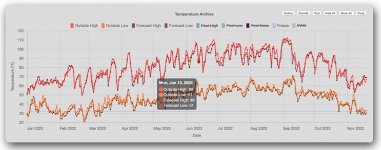
Here is just the air temps. I’m also storing the forecasted temps (in browns), so I can see how they stack up to what is actually happening in my yard.

chart-5.jpg

The most recent upgrade was making the chart lines clickable. I can click any data point in the Archive chart and view the chart for that day! Eventually I’ll have years (decades?) worth of temperature data specific to my yard and pool, for each and every day. Global warming you say? Well, we’ll just see about that (literally)!

There's more, of course, but you get the gist.

So there you go, more than you needed to know about my “Ultimate Thermometer!”


EDIT April 21, 2023: I neglected to mention that the ControlByWeb device has built in charting that is very robust, and can email data as well. All the custom display and chart work I did is not required to get temperature data in several useful formats. And you can view current temperature and all the stored, past data via a web browser, wherever you happen to be, on whatever device you have with you.
 
Last edited:
Since you have a heater, I would want an inlet and outlet temperature so that you can monitor the temperature rise from inlet to outlet to see if it is what it should be based on the flow rate.

You can have the system calculate the expected temperature rise based on the flow rate and compare it against the actual temperature rise.

I would also want to track the exhaust temperature to see if that is where it should be and if it changes in a way that can predict any problems like sooting or scaling.
 
  • Like
Reactions: Dirk
I have an indoor and outdoor fully autonomous drone each with a thermal camera so that I can do a thermal scan of the entire property inside and outside continuously to look for any anomalies and to track the temperature of everything.

The cameras are FLIR M500 High-Performance Maritime Camera Systems.

 
Since you have a heater, I would want an inlet and outlet temperature so that you can monitor the temperature rise from inlet to outlet to see if it is what it should be based on the flow rate.

You can have the system calculate the expected temperature rise based on the flow rate and compare it against the actual temperature rise.

I would also want to track the exhaust temperature to see if that is where it should be and if it changes in a way that can predict any problems like sooting or scaling.
Well, you better get to work on that!! 😜
 
  • Like
Reactions: JamesW
I have an indoor and outdoor fully autonomous drone each with a thermal camera so that I can do a thermal scan of the entire property inside and outside continuously to look for any anomalies and to track the temperature of everything.

The cameras are FLIR M500 High-Performance Maritime Camera Systems.

I like it, but your screenshot is just a black box, so I can't tell if you're joking or not! But I have thought of having a drone capable of flying around my yard to check on areas my cams can't see, so I'm with ya, even if you were joking! 😂
 
  • Like
Reactions: JamesW

Enjoying this content?

Support TFP with a donation.

Give Support
I have an indoor and outdoor fully autonomous drone each with a thermal camera so that I can do a thermal scan of the entire property inside and outside continuously to look for any anomalies and to track the temperature of everything.

The cameras are FLIR M500 High-Performance Maritime Camera Systems.

I can see it now. Me want!!
 
  • Like
Reactions: JamesW
Washington Nationals GIF by MLB
 
Wow, nice setup. It's great to see the pool temperature remotely and I've been using the IntelliCenter temperature probe to get readings. However that's only accurate whilst the pump is running. I'm thinking of getting a cheap WT0124 Pool Thermometer for other times. Since it uses 433Mhz to wirelessly transmit to the base station you can use the rtl_433 project to capture the temperature transmissions and it can be configured to use MQTT to forward those readings onto Home Assistant. FWIW you can also get Govee Water Leak Detectors to do something similar as they also use 433Mhz that can be picked up with a USB RTL-SDR Receiver.

 
Last edited:
  • Love
Reactions: plnewb
Wow, nice setup. It's great to see the pool temperature remotely and I've been using the IntelliCenter temperature probe to get readings. However that's only accurate whilst the pump is running. I'm thinking of getting a cheap WT0124 Pool Thermometer for other times. Since it uses 433Mhz to wirelessly transmit to the base station you can use the rtl_433 project to capture the temperature transmissions and it can be configured to use MQTT to forward those readings onto Home Assistant. FWIW you can also get Govee Water Leak Detectors to do something similar as they also use 433Mhz that can be picked up with a USB RTL-SDR Receiver.

Thanks.

I looked at that sensor, and several similar. I passed because:
- battery, (I hate relying on batteries)
- wireless, (I hate relying on wireless even more than batteries)
- measures surface temp, and in whatever area it happens to float into
- vulnerable to rambunctious grandkids!

Granted, there may be no other pool on the planet that would allow a retrofit wired temp sensor install like I pulled off, and surface temp vs 2' below is not that big of a deal. And grandkids can break anything, so that's not really a decider either way. Whatever you do, it'll be worth the effort. Having access to 24hr pool temp, removed from the limitations of Pentair automation, has proven to be very convenient. I used it multiple times a day in the swim season, and have been monitoring it in the off season for the SWG management. As I mentioned, a decent hard-wired temp sensor should be a standard swimming pool build option.

I actually considered running it through my pool light's conduit, to access the water that way, but used the equalizer tube instead because of how the heat from the light might affect the reading. But if someone else was interested in a hardwired solution, maybe the light niche could be used in some way. Pool lights aren't on that much of the time anyway.
 
  • Like
Reactions: JamesW and guinness
Since you have a heater, I would want an inlet and outlet temperature so that you can monitor the temperature rise from inlet to outlet to see if it is what it should be based on the flow rate.

You can have the system calculate the expected temperature rise based on the flow rate and compare it against the actual temperature rise.

I would also want to track the exhaust temperature to see if that is where it should be and if it changes in a way that can predict any problems like sooting or scaling.
I just reread this and it sounds like you're talking about a gas heater. I have a roof-top solar heater, and I expect there is no "expected temperature rise based on the flow rate" as the heat on the panels would not be constant like you'd expect a gas heater to produce. And of course there is no exhaust temperature. I do have a gas heater, but I've never even turned it on.

It would be interesting to see a chart of how the heat on the panels affects the difference between the inlet and outlet temperatures. My EasyTouch could provide two of the three, as I already have a "pre-solar-heater" temp sensor, and a temp sensor on the roof (they're used by EasyTouch to control the solar heater). I'd just need a "post-solar-heater" temp sensor. Hmmm...

I'd have to get around the fact that the Pentair sensors are "dumb," based on resistance, and the sensors my gizmo reads are digital.
 
  • Like
Reactions: JamesW
If you know the flow rate and the temperature rise, you can calculate the amount of heat a heater is putting out.

A gas heater has a known expected amount of heat that you can use as a comparison.

A solar heater has a variable heat output, so you don’t know how much it should put out, but you can still calculate how much it is putting out.

By watching relevant data such as how much solar radiation your roof gets, you can begin to develop a formula for expected heat output based on solar radiation.

For example a UV index is an indication of how much solar radiation is reaching the ground.

This, combined with other factors like the angle of the sun, can be correlated with the calculated heat output of the panels to allow for an expected heat output formula.
 
  • Like
Reactions: Dirk
1669647960983.png
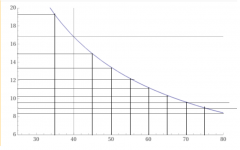
This shows the expected temp rise (inlet to outlet) (Y-axis) vs. Flow in GPM (X-axis) for a 400,000 btu/hr heater at 84% efficiency.

The minimum required flow is 40 gpm.

So, the maximum temp rise should be 16.8 degrees Fahrenheit.

If the heater output matches the blue line graph, you can assume that the heater is probably working correctly.

If the output falls below the graph, you can assume that the heater might be underperforming for some reason.
 
  • Like
Reactions: Dirk
I got inspired to keep track of all this data, seein's how I went to so much trouble to gather it. So I first programmed my HA software to update an HTML webpage (my HA software is also a web server, so it can serve not only my HA control pages (locally and online if I choose), it can also serve any HTML page). The HA software stores 10 days worth of temperature data in local variables. I wrote a python program that parses that stored data to an HTML doc, which gets updated every time any of the temperatures change. I’m only tracking outdoor and pool temps. I could have tracked all six sensors, but I didn’t really need to see that my house is always between 70 and 72 degrees! The original page looked like this:

View attachment 463916

It scrolled to show the current day and the previous ten days. It highlighted, with colored text, sunrise and sunset and various other events, plus listed high and low temps and forecast temps. And while I eventually could make it out well enough, it wasn’t particularly handy. So I foraged the ‘net for a charting solution and found a javascript library that worked great (chart.js). So after much struggling with html and javascript, I could get this:

View attachment 463917

I guess this is why they invented charts!! The chart floats over the old webpage version, which I can still scroll to read if I want to. The chart stays in the corner regardless of scrolling. I’ve been improving the chart all year and just finished a slew of upgrades. I’ll probably think of other things to add, but this is what I have so far.

The opening view displays the day’s outdoor (red) and pool (blue) temperatures, plotted over time, in hours. The chart updates when either temperature changes, but not more often than every 20 minutes (user configurable, of course). The yellow shaded area depicts daylight hours, bordered by yellow bands showing sunrise and sunset times. The horizontal aqua line is static at 52°, which is my SWG’s temperature threshold. I can see at a glance there is no SWG for me! The horizontal purple line is 32°. I can see the outdoor air temp in my yard dipped into freezing, when it happened, and when it warmed up. The two dotted green lines are the thresholds at which my citrus tree heaters turn on/off. Small icons get plotted for various events (sunrise, sunset, when my citrus tree heaters go on and off, etc). The little black triangle indicates the time of the last update (midnight in this chart). The horizontal yellow band is the forecasted high, the blue bands are the forecasted lows for each night.

View attachment 463918

Like the webpage, the chart can display the current day (red) along with the previous ten days (grey). Here, each day is displayed in an array of grey colors that get more transparent the older they are. The chart has a nice popup that shows the details for any data point. Along the top are clickable labels that can turn on/off any data set, and some buttons that display preset views. I can view any day, or any combo of days.

View attachment 463919

But that’s not all!! I’ve been collecting almost a year’s worth of highs and lows, for both outdoor and pool temps. Oranges are high/low outdoor temps. Blue is for the pool, high and low. The darker blue depicts when my solar heater was on for the day. The popup displays all the temps for any given day I hover over. This chart also has the static lines for the SWG threshold and freezing. I can see at a glance when it’s time to turn the ol’ SWG off for the winter. Also interesting to see how the pool temp is affected by the solar heater and the high and low air temps.

View attachment 463920

I can use the label controls and buttons to view various data sets, like just the pool and the state of the solar heater. The solar heater state is just a dot when the heater is on for just one day. You can see where I had the heater on for a few random single days here and there in April. But in the summer the heater was on every day and the dots get connected with a line. The popup can show the state of the heater for each individual day (as in the chart above). ScreenLogic can show past temperatures, too, but only when the pump was on, so I can't get high and low temps, like this:

View attachment 463921

I really lose a lot of heat each night! But it's clear that my solar heater helps keep the pool a bit more cozy. If/when I can get at the ScreenLogic protocol (my next project!), I'll add the heater state to the daily History chart, which will show exactly when the heater turns on/off throughout the day.

Here is just the air temps. I’m also storing the forecasted temps (in browns), so I can see how they stack up to what is actually happening in my yard.

View attachment 463922

The most recent upgrade was making the chart lines clickable. I can click any data point in the Archive chart and view the chart for that day! Eventually I’ll have years (decades?) worth of temperature data specific to my yard and pool, for each and every day. Global warming you say? Well, we’ll just see about that (literally)!

There's more, of course, but you get the gist.

So there you go, more than you needed to know about my “Ultimate Thermometer!”
Very nice work! What HA program do you use?
 
  • Like
Reactions: Dirk
Very nice work! What HA program do you use?
Thanks! Indigo (MacOS and iOS only, they don't develop for any other platforms).

What makes this all possible is Indigo's interface customization capability, third party plugin support (that's how I get NOAA data), and python scripting support.

Indigo's built-in capabilities are very robust, but if the developers didn't include something, a third party developer probably made a plugin for it. And if that still doesn't get you what you want, you can turn to python scripting and roll your own. I counted them the other day, I have over 200 python scripts. Most of them just short one or two liners, but some are pages long. Some were developed and improved over years.

The javascript and html I ether figured out or swiped from elsewhere (usually W3Schools or Stack Overflow).

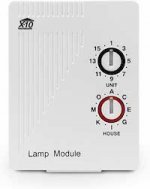
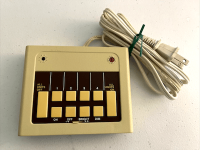
I've been goofing with HA for some 40 years now (geez, that's rough to say out loud). I started with two X-10 modules and an X-10 button controller. Older than old-school, baby! Pre-school? Maybe pre-old-school? ;)

x-10 module.jpgx-10 controller.png
 
Last edited:

Enjoying this content?

Support TFP with a donation.

Give Support
Thread Status
Hello , This thread has been inactive for over 60 days. New postings here are unlikely to be seen or responded to by other members. For better visibility, consider Starting A New Thread.