Dodger…when you talk about granularity of the IFCS manifold gauge, do you mean that you wish you had more control over it, or do you wish the PSI was simply higher so that you can play with it?
Backtracking a bit. For energy analysis, I used one starting back in the 2
nd post of this thread that was based on Gallons/kWh. Unknown to me at the time was that there is already a standard, called Energy Factor (EF), for pool pumps that is essentially the exact same number I calculated, but divided by 1000. I will use EF from now on. The higher the EF, the more energy efficiently you are operating your pump at. Generally, lower pump RPMs result in higher EFs, until a limit is reached. For a given pump operating state, EF is calculated as follows:
EF = (Pump GPM)* 60 / (pump watts)
EX: If your pump is moving 70gpm and using 762 watts, the EF is calculated as follows:
EX: EF= (70 * 60) / 762 = 5.70
To determine the number of gallons pumped by your pool pump per kWh (this is what the electrical company charges for), simply multiply the EF by 1000. In our example: 5.70 * 1000= 5700 gallons/kWh.
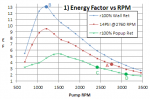
I ran some experiments today and am going to post some charts of my system’s EF vs other numbers. My In-Floor Cleaning System (IFCS) was one of the early ones built in 1993. As a result, there may be some disadvantages that my system has that are fixed in more modern IFCSs, but I am not sure because I haven’t seen any other pool data. Disadvantages in my system are that I have older popup heads which can’t be upgraded (A&A type 1), 1.5 inch return lines to the popups (45-50 max gpm recommended for that size pipe). Advantages I have in my system: relatively short 2” suction pipe from skimmer/drain to the pump with few fittings, large filter to reduce pressure loss, simple system with no heater, and low loss 2” return path via wall returns.
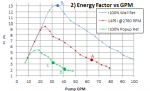
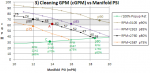
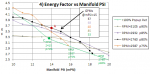
Here are two of the graphs and the experimental data tables used to create them. Currently I am operating under the assumption that my IFCS needs 14psi at the manifold to properly drive the popups and clean my pool effectively; 14psi at the manifold sends about 32gpm back through my popups.
Point A on the charts is where I am currently operating my pump when running the popups (14psi @ manifold,
plus sends 30 gpm back through the wall returns via my new IFCS bypass valve shown in the picture a few posts back).
Point B on the charts is where I am currently operating my pump when skimming/filtering, all through the wall returns.
Point C on the charts is where I would most efficiently operate my pump IF I ran 100% of the return through my popups (14psi @ manifold, 0 gpm back through the wall returns).
Point D on the charts is the approximate location that I ran my single speed 1.5hp pump for 21 years, and lost all that money because of the inefficiency...because I could have been running at
point A by simply opening the wall return valve slightly.
There are some interesting conclusions for my system, and possibly others, that can be gained by looking at those curves, but I don’t have time to comment on that this afternoon. I believe that the 100% wall return curve (blue) and the 100% popup return curves (green) would be very useful to graph for those with Variable Speed Pumps (VSPs) in their IFCS. I also have some other plots that I hope to post later.
| Pool Return r100% through Wall | | | | |
| RPM | GPM | Watts | | EF |
| 3450 | 108 | 2385 | | 2.72 |
| 3277 | 104 | 2046 | | 3.05 |
| 3105 | 101 | 1727 | | 3.51 |
| 2932 | 97 | 1448 | | 4.02 |
| 2760 | 91 | 1202 | | 4.54 |
| 2587 | 86 | 989 | | 5.22 |
| 2415 | 79 | 807 | | 5.87 |
| 2242 | 73 | 648 | | 6.76 |
| 2070 | 67 | 520 | | 7.73 |
| 1897 | 60 | 415 | | 8.67 |
| 1725 | 53 | 331 | | 9.61 |
| 1552 | 46 | 264 | | 10.45 |
| 1380 | 41 | 212 | | 11.60 |
| B 1207 | 35 | 161 |
| 13.04 |
| 1035 | 28 | 136 | | 12.35 |
| 862 | 21 | 136 | | 9.26 |
| 690 | 12 | 131 | | 5.50 |
| Pool Return r100% through Popups | | | | |
| RPM | GPM | Watts | mPSI | EF |
| 3450 | 48 | 1602 | 30.5 | 1.80 |
| 3277 | 44 | 1377 | 27 | 1.92 |
| D 3105 | 41 | 1179 | 24 | 2.09 |
| 2932 | 39 | 989 | 21 | 2.37 |
| 2760 | 37 | 836 | 18.5 | 2.66 |
| 2587 | 34 | 691 | 16 | 2.95 |
| C 2415 | 31 | 573 | 13.75 | 3.25 |
| 2242 | 29 | 469 | 12 | 3.71 |
| 2070 | 27 | 384 | 9.75 | 4.22 |
| 1897 | 24 | 315 | 7.75 | 4.57 |
| 1725 | 21 | 257 | 6.5 | 4.90 |
| 1552 | 19 | 212 | 5 | 5.38 |
| 1380 | 15 | 169 | 4 | 5.33 |
| 1207 | 11 | 140 | 3 | 4.71 |
| 1035 | 9 | 136 | 2 | 3.97 |
| 862 | 8 | 131 | 2 | 3.66 |
| 690 | 7 | 131 | 2 | 3.21 |
The way I generated the next table was to adjust my new IFCS bypass valve so that at a pump RPM of 2760, the manifold PSI=14. That bypass valve position was not changed (it was left in its partially open position) as I then ran the pump through its RPM range (from 3450 down to 690 in 5% increments).
| TEST POINT #1, 14PSI @ 2760RPM | | | | |
| RPM | GPM | Watts | mPSI | EF |
| 3450 | 79 | 2018 | 23 | 2.35 |
| 3277 | 76 | 1743 | 20.5 | 2.62 |
| 3105 | 72 | 1487 | 18 | 2.91 |
| 2932 | 68 | 1225 | 16 | 3.33 |
| A 2760 | 64 | 1035 | 14 | 3.71 |
| 2587 | 59 | 851 | 12 | 4.16 |
| 2415 | 54 | 695 | 10 | 4.66 |
| 2242 | 50 | 565 | 8.5 | 5.31 |
| 2070 | 46 | 462 | 7 | 5.97 |
| 1897 | 41 | 367 | 5.5 | 6.70 |
| 1725 | 36 | 296 | 4.76 | 7.30 |
| 1552 | 31 | 241 | 4 | 7.72 |
| 1380 | 28 | 194 | 3 | 8.66 |
| 1207 | 24 | 152 | 2 | 9.47 |
| 1035 | 20 | 136 | 2 | 8.82 |
| 862 | 15 | 131 | 2 | 6.87 |
| 690 | 9 | 131 | 2 | 4.12 |

") )
)