Dynamic GPM Calculations
- Thread starter jonpcar
- Start date
You are using an out of date browser. It may not display this or other websites correctly.
You should upgrade or use an alternative browser.
You should upgrade or use an alternative browser.
Absolutely...but let me clean it up a bit. The charts are being extracted from Excel...although the raw data is captured in Google Sheets which I am not as comfortable working in. So I could share a google sheet with all the raw data and/or email? an excel sheet.I wouldn't mind taking a look at the raw data if you have it in Excel or Google sheets form.
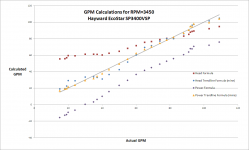
I changed a couple items and I ran the RPM=3450 test case and captured the numbers. The results make me want to rerun the other rpm curves because it looks much cleaner. It takes about 15 minutes to capture a curve...but even that amount of time in the Phoenix SUN it was pretty hot.
So all these test cases are "static" in the sense that WHILE I am taking a particular measurement, no valves are changing. The changes I made were that I am now sampling the PSIs 100 times a second and averaging those values to obtain the "instantaneous" PSI. I have increased my sampling of the voltage/current for power calculations as well. That has gone from 5 complete samples & calculations per second to 16. That dramatically improved the constancy of the numbers that I saw in both power and psi when refreshing the numbers on a random basis (as long as the valves and rpm were not being changed, of course).
So the RPM=3450 graph below was taken with the "new methodology"
Not a lot of change on Head Formula. My system does not have any "real paths" that generate the low GPM numbers that I capture. Those are generated only through closing valves towards "deadheading" the pump. Is that method consistent with generating the Dynamic Head numbers?
One thing I noticed about both of the Power generated curves (Power Formula & Power Trendline Formula for both RPM=1750 in the previous post and for RPM=3450 below)...They are almost identical except they are offset by about 20 in the first chart, and offset by roughly 30 in the below case (maybe a slightly different slope as well).
EDIT: actually the two Head Formulas in both cases give similar (in shape) calculations as well, except that the slope and intercepts are significantly different

Anyway, I'll try to rerun the other curves tomorrow morning when it is cooler.
Last edited:
Yeah I have heard that a few times...my response since I have tuned it: I really like my IFCS and it has provided cord-free and tube-free cleaning for 27 years...and NOW, it is actually very cost effective as well. Not when compared to the run time of Mark's system though... haha.Maybe you can convert the in-floor returns into regular returns and get a robot.
Mark, I took some additional measurements this morning and finished putting all that raw data together. Once again, I have also changed the methodology to "step through" the various points in the curve and record them. The link to the raw data in google sheets is at the bottom of this post.
All the latest measurements rely on "deadheading" the pump, to some degree through the use of valve settings which I can step through in 1% steps (in terms of possible movement). 1% steps are only needed on the highest RPMs...usually it is 2-3-5% movements in the "critical areas" where valve movement is having an impact on GPM.
The latest data (dated 7/5, 7/6) relies on using my main Waterfall actuator valve which starts out at 100% position. At the same time, 2of3 individual waterfall valves (that control flow between the waterfalls) are OFF and the third is set at a very restrictive setting that only allows about 10gpm to flow through it. The data measurement starts by setting the appropriate pump RPM, and then slowly changing the main Waterfall actuator valve from Waterfall (very restrictive 100%, only ~10gpm through waterfall) to Wall Returns (least restrictive position 0%). At each step, if the GPM has changed (by viewing the FlowVIS), then that data point is recorded. You will see this on the spreadsheet.
A few notes
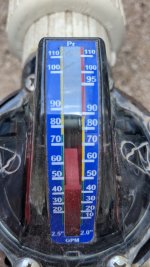
(1) My FlowVIS 2" model does NOT accurately record GPMs between 90 and about 102. There is some mechanical issue with those values and FlowVIS's gauge tries to deal with it in the scale. See picture below, my 2" gauge is on the right. It doesn't work. I can clearly "feel" the problem as I open valves wider in that section...increased GPM does not show up as in prior valve changes...and then suddenly it POPs from about the 94gpm measurement to the 102/103gpm on a single 1% valve change. Also the data points from those locations are NOT consistent with the rest of the curve. So I now ignore the data from 90-100gpm in all samples.

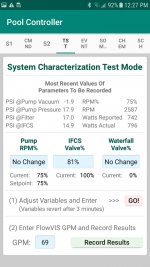
(2) There are very few "bad" data points, especially with the latest methodology, but there are a couple ways that it can (& does) happen. (a) I enter a wrong gpm number, which must be done manually...screenshot below (b) I record the gpm too quickly before the system has settled down. This occurred a few times in data taken before the last couple days. I don't believe the latest data from the last two days has any of those.

(3) I have included all the previous data that I have taken in the prior couple weeks which might be useful as sample points, but keep in mind that the system parameters (averaging of psi & power measurements) were significantly different in much of that data.
Anyway...here is the link to the raw data, anyone should be able to access it. Let me know if anything doesn't make sense.

 docs.google.com
When I get some time, I am going to look at my latest captured data.
All the latest measurements rely on "deadheading" the pump, to some degree through the use of valve settings which I can step through in 1% steps (in terms of possible movement). 1% steps are only needed on the highest RPMs...usually it is 2-3-5% movements in the "critical areas" where valve movement is having an impact on GPM.
The latest data (dated 7/5, 7/6) relies on using my main Waterfall actuator valve which starts out at 100% position. At the same time, 2of3 individual waterfall valves (that control flow between the waterfalls) are OFF and the third is set at a very restrictive setting that only allows about 10gpm to flow through it. The data measurement starts by setting the appropriate pump RPM, and then slowly changing the main Waterfall actuator valve from Waterfall (very restrictive 100%, only ~10gpm through waterfall) to Wall Returns (least restrictive position 0%). At each step, if the GPM has changed (by viewing the FlowVIS), then that data point is recorded. You will see this on the spreadsheet.
A few notes
(1) My FlowVIS 2" model does NOT accurately record GPMs between 90 and about 102. There is some mechanical issue with those values and FlowVIS's gauge tries to deal with it in the scale. See picture below, my 2" gauge is on the right. It doesn't work. I can clearly "feel" the problem as I open valves wider in that section...increased GPM does not show up as in prior valve changes...and then suddenly it POPs from about the 94gpm measurement to the 102/103gpm on a single 1% valve change. Also the data points from those locations are NOT consistent with the rest of the curve. So I now ignore the data from 90-100gpm in all samples.

(2) There are very few "bad" data points, especially with the latest methodology, but there are a couple ways that it can (& does) happen. (a) I enter a wrong gpm number, which must be done manually...screenshot below (b) I record the gpm too quickly before the system has settled down. This occurred a few times in data taken before the last couple days. I don't believe the latest data from the last two days has any of those.

(3) I have included all the previous data that I have taken in the prior couple weeks which might be useful as sample points, but keep in mind that the system parameters (averaging of psi & power measurements) were significantly different in much of that data.
Anyway...here is the link to the raw data, anyone should be able to access it. Let me know if anything doesn't make sense.
GPM Charting for Hayward EcoStar SP3400VSP
When I get some time, I am going to look at my latest captured data.
Last edited:
So I've looked at more of the data (with graphing) and I see what Mark was talking about regarding the accuracy of the Watts>GPM calculations vs the Head(PSI)>GPM calculations. Calculations using the dynamic Head seem to be more reliable over a larger RPM range. Calculations using the wattage seem to start fizzling out (become less accurate) below the 30-35% Max RPM range. As he stated, the slope of the wattage curve becomes very steep and small inaccuracies in wattage measurement cause very different GPM readings.
It is a bit similar for the Dynamic Head calculations...but (at least with the changes I have made to the sampling cycles) there seems to be more consistent PSI sampled values obtained on those curves: the latest baseline psi readings are more linear, with less noise/variance than the wattage calculations.
I have a couple questions...is it even worthwhile trying to characterize/evaluate data in ranges that will probably never occur in real systems, especially the scenarios that are more contrived such as running the pump at 85% RPM with a volume of <20GPM. It probably isn't...
How does the FlowVIS itself impact the flows?...it seems to me that some of the dynamic head calculations in the GPM "very low ranges" is OFF. Could the FlowVIS significantly impact those psi measurements? I do plan on taking out the FlowVIS after I am convinced I can get accurate GPM calculations from the underlying data itself, and will probably do some comparisons to see if there actually was an impact. Mark, you have told me in the past that you wouldn't expect to see significant differences with/without FlowVis. But, I'm particularly wondering about the the low GPM ranges now.
Thanks for any comments.
- May 3, 2007
- 18,071
- Pool Size
- 20000
- Surface
- Plaster
- Chlorine
- Salt Water Generator
- SWG Type
- Hayward Aqua Rite (T-15)
I haven't had a chance to review the data but I do plan on it.
The FloVis has head loss like any other fitting. Here is the FloVis manual which has head curves: https://static1.squarespace.com/sta...80484/1620309880007/FlowVis+Manual+Rev5.3.pdf
Probably not. I am not sure I see a clear benefit doing what you are either. You really don't need to get that much into the weeds to figure out how to run the system efficiently. The in-floor has a minimum pressure/flow rate to make it run effectively. That by definition is the minimum RPM you should run at and defines the most optimum RPM. Lower RPM, lower energy use, higher efficiency. Other than that, run time is the next biggest factor..is it even worthwhile trying to characterize/evaluate data in ranges that will probably never occur in real systems, especially the scenarios that are more contrived such as running the pump at 85% RPM with a volume of <20GPM. It probably isn't...
The FloVis has head loss like any other fitting. Here is the FloVis manual which has head curves: https://static1.squarespace.com/sta...80484/1620309880007/FlowVis+Manual+Rev5.3.pdf
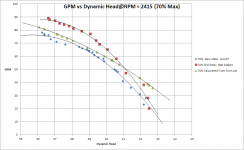
Hey Mark...I found a problem with the spreadsheet I posted. There is a gasket on the FlowVIS check valve that had worked itself loose in a couple spots. It was dangling "out" on a couple portions of the paddle that were near the "end" of the paddle. That led to "increased GPMs" being reported because of the additional drag on the paddle. I found this out only when I took out the FlowVis. I suspect that possibly the gasket became dislodged when I ran those 100% numbers but I have no way of knowing when it occurred or what data is valid/invalid. I fixed the gasket and reran a couple of the curves and sure enough...the numbers were different.
The good news is that the new numbers are closer to the "actual formula" that you provided, but there still seems to be a fair discrepancy/divergence in the lower gpm ranges.
So hope you haven't start looking at the data yet, but I will load the new "curves" into that spreadsheet at the top...it only consists of a few RPMs that I am considering running. So at this point it may not be of any use or interest to you. It doesn't include any 100% numbers. Don't feel like you even have to look through it. Monday I will be taking off for a couple weeks so I won't be able to work on this again for awhile. Thanks for your help...
Here is a chart that shows the discrepancy in GPM readings that the loose gasket caused...

Last edited:
- May 3, 2007
- 18,071
- Pool Size
- 20000
- Surface
- Plaster
- Chlorine
- Salt Water Generator
- SWG Type
- Hayward Aqua Rite (T-15)
I should have given you this originally but here is the formula coefficients for the published head curve (Hayward). This is really what you should be comparing to:
Q = Qm * sqrt((rpm/3450)^2 - H/Hm)
Qm = 214
Hm = 93
If your measurements don't fall on this curve, then there is probably measurement error involved although I can't vouch for the accuracy of published head curves.
These are a bit different than the original ones I gave you which were determined from EnergyStar test data (which probably has it's own error).
@jonpcar
jon,
Have you considered adding in the FlowVis Digital conversion kit to the mix?
I'm really liking mine now that I have it setup and going.
I agree with you regarding the diff in numbers (flow as well as power consumption) from what the pump reports at the lower speeds.
Thanks to the SME guys here, I now understand why but that is a whole different topic (thread).
 www.troublefreepool.com
Stay cool
r.
jon,
Have you considered adding in the FlowVis Digital conversion kit to the mix?
I'm really liking mine now that I have it setup and going.
I agree with you regarding the diff in numbers (flow as well as power consumption) from what the pump reports at the lower speeds.
Thanks to the SME guys here, I now understand why but that is a whole different topic (thread).
IntelliFlo Numbers Confusing.
Ran across something the other day with my IntelliFlo pump that I can't figure out. At 700RPM, the pump reports using 35 watts and indicates 0 GPM (well, that's not right coz water is coming out of the returns but whatever). That's not my issue really. At 600RPM, the pump reports using 46...
Stay cool
r.
Hey thanks Mark. I was already looking at adjusting those numbers slightly to "match" my data. But, after that "gasket movement" on my FlowVIS, I am going to step back and make sure the FlowVis numbers are valid before moving ahead with this project. I really do like the idea of "one formula to rule them all" if it's close to what I am actually measuring.I should have given you this originally but here is the formula coefficients for the published head curve (Hayward). This is really what you should be comparing to:
Q = Qm * sqrt((rpm/3450)^2 - H/Hm)
Qm = 214
Hm = 93
If your measurements don't fall on this curve, then there is probably measurement error involved although I can't vouch for the accuracy of published head curves.
These are a bit different than the original ones I gave you which were determined from EnergyStar test data (which probably has it's own error).
Ron...thanks for the pointer to that thread...I had missed that one. I haven't really considered moving to the digital FlowVis...I think I am going to get accurate GPM numbers using the method that the pump guys have been helping me out with. But, I DO like the digital FlowVis results that you documented in that thread. How do you extract readings?...and how OFTEN can you get them? I am trying to get down to 1/2 to 1 second readings as the gpm changes pretty quickly with my IFCS (more so with some of the "experiments" with pump RPM and valve positioning/movement that I am planning).@jonpcar
jon,
Have you considered adding in the FlowVis Digital conversion kit to the mix?
I'm really liking mine now that I have it setup and going.
I agree with you regarding the diff in numbers (flow as well as power consumption) from what the pump reports at the lower speeds.
Thanks to the SME guys here, I now understand why but that is a whole different topic (thread).
IntelliFlo Numbers Confusing.
Ran across something the other day with my IntelliFlo pump that I can't figure out. At 700RPM, the pump reports using 35 watts and indicates 0 GPM (well, that's not right coz water is coming out of the returns but whatever). That's not my issue really. At 600RPM, the pump reports using 46...www.troublefreepool.com
Stay cool
r.
But, right now I am not trusting my FlowVIS gpm numbers as I just realized a couple days ago mine had a gasket problem. So I was planning to do a "bucket type test" as you did in that thread to make sure that the numbers I am getting are valid. Once I correlate, I will semi-permanently replace the FlowVis gauge with a Jandy check-valve blank. But, I'm headed back to the cabin remodel for a couple weeks so it will have to wait. Thanks for the info.
Thread Status
Hello , This thread has been inactive for over 60 days. New postings here are unlikely to be seen or responded to by other members. For better visibility, consider Starting A New Thread.

