Hi All,
Recently I have been doing a lot of playing around with Grafana and InfluxDB v1.8.3. Mostly, in order to better manage and access my swimming pool automation, sensor and chemical control historical data.
Grafana makes it great to do so, since I can view the historical and current data in ANY context or time period that I wish. It appears that Grafana makes the management of pool automation data much better than anything that can be found bundled with the big 3 pool automation platforms.
But I also know that my current Grafana dashboard can be improved even more.
So, I am looking for other experienced Grafana/InfluxDB users out there that may wish to share their ideas and the fruits of their labor, etc.
Things like the following:
I’ll go ahead and post what I currently have and would hope that there might be a few other pool automation DIYers out there that happen on to this thread who may wish to do the same.
In full disclosure, I did not develop the dashboard that I am currently using from scratch.
I had started with my own dashboard originally, then I lost all of my work on “Docker” (which I had no concept of.) I then decided to download Grafana directly to my Mac and started over.
Initially, @tagyoureit had assisted me with the setup of InfluxDB and Grafana. When I informed him on what had happened, he was kind enough to share the dashboard that he was working on and I imported his dashboard template into my own. I can't thank him enough for all of his assistance in the course of this project!
I used much of his base work and set out to modify it to my own preferences, setup etc. Modifying some panels and using his templates to create some of my own panels. I even found a cool new Grafana “dial” plugin in which to incorporate.
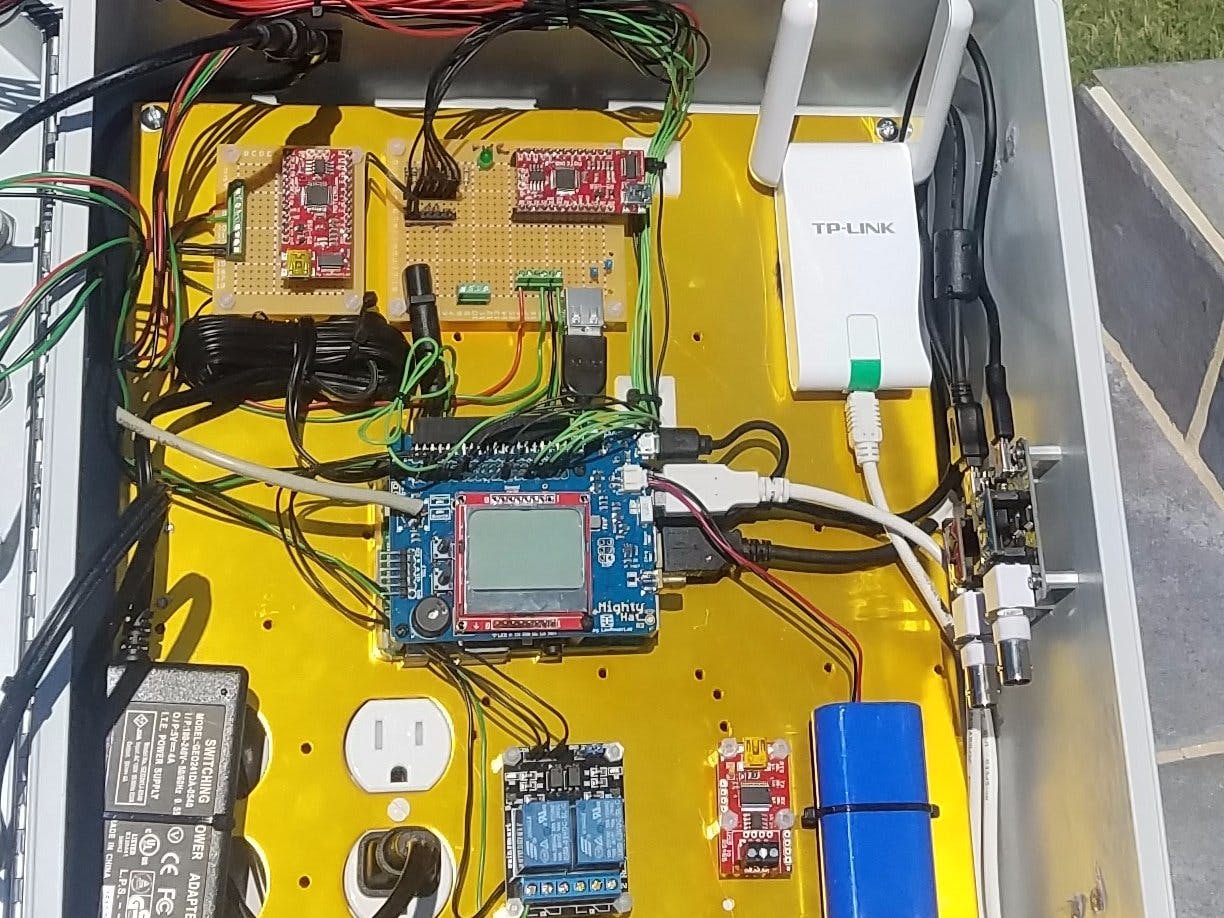
Although my Grafana log files etc., reside on my Mac. InfluxDB resides on a Raspberry Pi solely dedicated for that task and pulls its data from the nodejs-poolController that resides on a different RPi.
Note 1: I should really note here that there is a companion piece of software that is in final stages of development/beta testing that really goes hand-in-hand with the Grafana output but I’ll share more on that later.
Note 2: The bindings directions for integrating InfluxDB with the nodejs-poolController can be found in the following link.

 github.com
I did find three other threads and/or posts here on TFP that do mention the use of Grafana. I'll go ahead and include the links to them below.
 www.troublefreepool.com
www.troublefreepool.com
www.troublefreepool.com
www.troublefreepool.com
www.troublefreepool.com
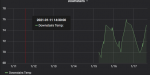
Anyway, I have included below a screen capture of where I’m at presently. If anyone has any ideas on how my Grafana output can be improved/modified, or you wish to share your own InfluxDB/Grafana work, your input and contributions are certainly welcome.
Thanks in advance…
r..

Recently I have been doing a lot of playing around with Grafana and InfluxDB v1.8.3. Mostly, in order to better manage and access my swimming pool automation, sensor and chemical control historical data.
Grafana makes it great to do so, since I can view the historical and current data in ANY context or time period that I wish. It appears that Grafana makes the management of pool automation data much better than anything that can be found bundled with the big 3 pool automation platforms.
But I also know that my current Grafana dashboard can be improved even more.
So, I am looking for other experienced Grafana/InfluxDB users out there that may wish to share their ideas and the fruits of their labor, etc.
Things like the following:
- Dashboard templates
- Panels
- Plug-ins
I’ll go ahead and post what I currently have and would hope that there might be a few other pool automation DIYers out there that happen on to this thread who may wish to do the same.
In full disclosure, I did not develop the dashboard that I am currently using from scratch.
I had started with my own dashboard originally, then I lost all of my work on “Docker” (which I had no concept of.) I then decided to download Grafana directly to my Mac and started over.
Initially, @tagyoureit had assisted me with the setup of InfluxDB and Grafana. When I informed him on what had happened, he was kind enough to share the dashboard that he was working on and I imported his dashboard template into my own. I can't thank him enough for all of his assistance in the course of this project!
I used much of his base work and set out to modify it to my own preferences, setup etc. Modifying some panels and using his templates to create some of my own panels. I even found a cool new Grafana “dial” plugin in which to incorporate.
Although my Grafana log files etc., reside on my Mac. InfluxDB resides on a Raspberry Pi solely dedicated for that task and pulls its data from the nodejs-poolController that resides on a different RPi.
Note 1: I should really note here that there is a companion piece of software that is in final stages of development/beta testing that really goes hand-in-hand with the Grafana output but I’ll share more on that later.
Note 2: The bindings directions for integrating InfluxDB with the nodejs-poolController can be found in the following link.
Create new page · tagyoureit/nodejs-poolController Wiki
An application to control pool equipment from various manufacturers. - Create new page · tagyoureit/nodejs-poolController Wiki
github.com
I did find three other threads and/or posts here on TFP that do mention the use of Grafana. I'll go ahead and include the links to them below.
Automating Pump & Solar using Arduino for under 40 bucks
Edit: See post #3 for the updated controller. Edit 2: Now with full SmartThings integration for both Pump Control, Temperature readouts, and Solar control. See post #9 for a screenshot of the interface. When my single-speed pump failed, I did some research and realized I'd have an issue...
www.troublefreepool.com
Raspberry Pi for pool monitoring?
Any IT guys thought about using a Raspberry pi for any type of pool monitoring, ie. Temps, chlorination levels, etc. I'm out of any free time right now, but I like the idea. Sent from my SAMSUNG-SM-G870A using Tapatalk
www.troublefreepool.com
IntelliCenter Home Automation Integration and Control
@MyAZPool Have you been able to make any progress on this? I am still a way out from having my IntelliCenter installed but advanced control by my Home Automation system is a must for me. I have been searching the internet and found a very interesting and currently active github project: node.js...
www.troublefreepool.com
Anyway, I have included below a screen capture of where I’m at presently. If anyone has any ideas on how my Grafana output can be improved/modified, or you wish to share your own InfluxDB/Grafana work, your input and contributions are certainly welcome.
Thanks in advance…
r..