- Aug 19, 2022
- 68
- Pool Size
- 34000
- Surface
- Plaster
- Chlorine
- Salt Water Generator
- SWG Type
- CircuPool RJ-60 Plus
I’m a longtime lurking reader of TFP who has recently decided to start posting (my intro is here). Thus, I thought that I’d share a tiny bit of experimental data that I generated last summer on pump speeds and their corresponding current draws on my system:
In abstract, I experimentally confirmed that my variable speed pump generates flows that increase linearly with pump RPMs over the entire range of tested speeds. But, as expected, the current draws for those flows increase exponentially. I’ve also plotted the cost of running my pump at various speeds to find a reasonable compromise: 50 GPM of flow would cost me $43.55/month if my pump were in continuous operation.
In more technical detail, I have a Jandy VS PlusHP 2.7 HP variable speed pump that I can set to arbitrary speeds in revolutions per minute (RPM). My pool has 2” piping. I’ve installed a FlowVis retrofit lid to my check valve that allows me to read flow with about +/- 2 GPM accuracy (available on Amazon with ASIN B074T1Q2C9). I used my Fluke T5-600 multimeter (ASIN B0006Z3GZU) in its ammeter setting to measure the corresponding 240V current draws on the adjacent sub panel; that instrument can read accurately at a resolution of 0.1A of AC.
I first set the pump RPMs to an initial value (1240 RPM) that resulted in a low flow of 30 gallons per minute (GPM). I then continued to vary the pump RPMs to find the values that were necessary to produce ever higher flows, each at 5 GPM intervals, up to a maximum of 90 GPM. Concurrently, I recorded the current draw (Amps at 240V) for each of these settings.
I had set out on this project after asking a simplistic question: “what is 'the best’ setting for my VS pump?” But I had quickly realized that this question doesn’t have a simple answer. I had initially looked for “pump curves” to see if they would add some insight. But I found them difficult to interpret for the task of dialing in my settings in the real world. Thus, I decided that it might be easiest to tackle the issue experimentally.
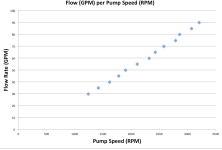
My first task was to determine the relationship between my pump speed and flow. When starting, I wasn’t quite sure what that would look like. But I hoped that it might be linear. If it had been logarithmic, then that would have suggested that extra inefficiencies (cavitation, etc.) were setting in at the higher speeds. But happily, the observed relationship was shockingly linear over the entire range that I tested:
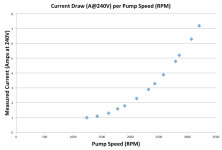
My second goal was to determine the relationship between my pump speed and its current draw. Since I had read some very helpful articles here on TFP, I already knew that pumps would draw dramatically more current at higher speeds. Indeed, as expected, the observed relationship grew exponentially, with ever-greater currents needed to sustain the increasing pump RPMs:
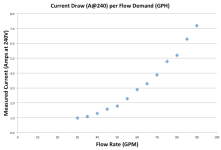
I also plotted the current draw for the various flow rates from the same data. I think this might have been the "ideal" pump curve that I would have liked to have had at the outset -- but unfortunately such curves probably cannot be provided by the manufacturers since they are dependent on other factors (e.g. piping) in each system:
Finally, using my approximate local electricity rate of $0.14/kWh, I estimated the cost of the various flow rates if I chose to operate my pump continuously 24/7:
(Measured Amps)(240V)(24h/d)(30d/mo)($0.14/kWh)/(1000W/kW):
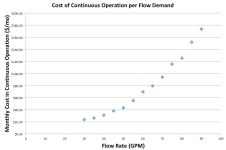
When beginning this small project, I had hoped that all these relationships might yield some “true optimum” for my pump speed -- that is, "the best" speed for my own pool. Ultimately, the observed data did not have an optimum “peak” or “valley". But they did show a reasonable “shoulder” to the growth of the current draw. Thus, I was able to pick an acceptable compromise for my own pump speed -- while avoiding an unnecessarily high electrical bill. Though I’ve changed my settings when needed based on my pool’s conditions, I’ve generally settled on 50 GPM at $43.55/month for continuous operation as a good compromise. Of course, I don’t operate my pump 24/7. But this baseline metric allows me to simulate my expected electricity use as I dial in my pool's settings.
Future directions might include pushing these data to further extremes of low and high pump speeds. It would also be interesting to determine the relationships with various inlet settings (all skimmers/drains open vs some closed) and at varying levels of sediment in my DE filter.
My raw data is provided here:
Thanks for reading. And “CYA later!"
Sampo
In abstract, I experimentally confirmed that my variable speed pump generates flows that increase linearly with pump RPMs over the entire range of tested speeds. But, as expected, the current draws for those flows increase exponentially. I’ve also plotted the cost of running my pump at various speeds to find a reasonable compromise: 50 GPM of flow would cost me $43.55/month if my pump were in continuous operation.
In more technical detail, I have a Jandy VS PlusHP 2.7 HP variable speed pump that I can set to arbitrary speeds in revolutions per minute (RPM). My pool has 2” piping. I’ve installed a FlowVis retrofit lid to my check valve that allows me to read flow with about +/- 2 GPM accuracy (available on Amazon with ASIN B074T1Q2C9). I used my Fluke T5-600 multimeter (ASIN B0006Z3GZU) in its ammeter setting to measure the corresponding 240V current draws on the adjacent sub panel; that instrument can read accurately at a resolution of 0.1A of AC.
I first set the pump RPMs to an initial value (1240 RPM) that resulted in a low flow of 30 gallons per minute (GPM). I then continued to vary the pump RPMs to find the values that were necessary to produce ever higher flows, each at 5 GPM intervals, up to a maximum of 90 GPM. Concurrently, I recorded the current draw (Amps at 240V) for each of these settings.
I had set out on this project after asking a simplistic question: “what is 'the best’ setting for my VS pump?” But I had quickly realized that this question doesn’t have a simple answer. I had initially looked for “pump curves” to see if they would add some insight. But I found them difficult to interpret for the task of dialing in my settings in the real world. Thus, I decided that it might be easiest to tackle the issue experimentally.
My first task was to determine the relationship between my pump speed and flow. When starting, I wasn’t quite sure what that would look like. But I hoped that it might be linear. If it had been logarithmic, then that would have suggested that extra inefficiencies (cavitation, etc.) were setting in at the higher speeds. But happily, the observed relationship was shockingly linear over the entire range that I tested:

My second goal was to determine the relationship between my pump speed and its current draw. Since I had read some very helpful articles here on TFP, I already knew that pumps would draw dramatically more current at higher speeds. Indeed, as expected, the observed relationship grew exponentially, with ever-greater currents needed to sustain the increasing pump RPMs:

I also plotted the current draw for the various flow rates from the same data. I think this might have been the "ideal" pump curve that I would have liked to have had at the outset -- but unfortunately such curves probably cannot be provided by the manufacturers since they are dependent on other factors (e.g. piping) in each system:

Finally, using my approximate local electricity rate of $0.14/kWh, I estimated the cost of the various flow rates if I chose to operate my pump continuously 24/7:
(Measured Amps)(240V)(24h/d)(30d/mo)($0.14/kWh)/(1000W/kW):

When beginning this small project, I had hoped that all these relationships might yield some “true optimum” for my pump speed -- that is, "the best" speed for my own pool. Ultimately, the observed data did not have an optimum “peak” or “valley". But they did show a reasonable “shoulder” to the growth of the current draw. Thus, I was able to pick an acceptable compromise for my own pump speed -- while avoiding an unnecessarily high electrical bill. Though I’ve changed my settings when needed based on my pool’s conditions, I’ve generally settled on 50 GPM at $43.55/month for continuous operation as a good compromise. Of course, I don’t operate my pump 24/7. But this baseline metric allows me to simulate my expected electricity use as I dial in my pool's settings.
Future directions might include pushing these data to further extremes of low and high pump speeds. It would also be interesting to determine the relationships with various inlet settings (all skimmers/drains open vs some closed) and at varying levels of sediment in my DE filter.
My raw data is provided here:
| Pump Speed (RPM) | Flow (gpm) | Current (A at 240V) | Cost of Cont Operation ($/mo) |
1240 | 30 | 1.0 | $24.19 |
1420 | 35 | 1.1 | $26.61 |
1620 | 40 | 1.3 | $31.45 |
1779 | 45 | 1.6 | $38.71 |
1900 | 50 | 1.8 | $43.55 |
2110 | 55 | 2.3 | $55.64 |
2320 | 60 | 2.9 | $70.16 |
2430 | 65 | 3.3 | $79.83 |
2580 | 70 | 3.9 | $94.35 |
2790 | 75 | 4.8 | $116.12 |
2860 | 80 | 5.2 | $125.80 |
3070 | 85 | 6.3 | $152.41 |
3209 | 90 | 7.2 | $174.18 |
Thanks for reading. And “CYA later!"
Sampo


