The EMI filter came yesterday, so this morning I went out in our swamp-like heat and played a bit. Using a cheap scope without onboard FFT, so I can really only look at waveforms, unless I dig out an old copy of MATLAB to import .wav files and FFT them.
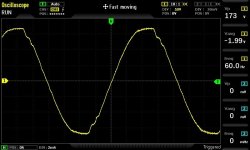
Here's measuring on the breaker, without the EMI filter installed:


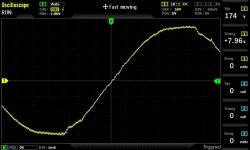
Then with the EMI filter installed:


As you can see, small differences, but nothing stark. I didn't bother zooming in further, to see if there were even higher frequency components, as I suspect VFD is all low frequency modulation.
A few observations:
That fine ripple seen in the images taken at 1 ms/div would be about 11 cycles / 1 ms = 11 kHz. The vertical scale is 50V/div, so the minor grid dots are 5V/ea, and the amplitude of that 11 kHz component is thus about 5V (= 10 V pk-pk) = 7 Vrms). Installing the filter knocked that component down a bit, from 10 V pk-pk to maybe 5 - 7 V pk-pk. Nothing huge, but maybe enough to make a difference.
Some of the other bigger glitches, such as that 15 V kick right at the tail end of the visible waveform in image 3, were also reduced. Maybe this makes a bigger difference.
The major "knees" after each waveform crest were mostly unaffected.
I had rigged this up in open air, nothing I could leave standing. I think I'll put this filter in an all-weather receptacle box, and nipple it onto the breaker panel, so I can re-install the GFCI breaker and see how it does. I also still need to pull the wiring out of it's underground conduit run, to make sure this isn't a simple case of damaged wiring causing the GFCI trips.


