This has been a project that has been in the works (sporadically) for a couple years. A number of the parts have been in place for over a year but I have finally gotten around to start piecing it together. I’m posting this hoping I can catch a bit of attention from the pump gurus on the forum (haha) that can tell me if I am on an OK path. Believe me, over the last couple days, I have really made a bunch of stupid mistakes…but , I THINK, it is coming together better than I had hoped.
I DO have some methodology questions before moving ahead (including whether I should re-do some of the data captured), but I’ll ask those in a follow up if there is any interest.
Why do I want the ability to know my GPM dynamically? The main reason is that I am planning some efficiency/effectiveness experiments with my In-Floor-Cleaning-System that will manipulate a number of factors. To evaluate the effect of changing these factors, I need to record GPM (cumulative/instantaneous) and Power Usage (cumulative/instantaneous). But there are a few other reasons as well, one of which is that this has been educational and fun!
The hardware and software pieces that have allowed this experiment include:
- instantaneous PSI measurements/capture on the pool pump suction/pressure sides
- instantaneous pool pump power measurements/capture
- precise valve actuator movement and positioning
This post contains a few charts:
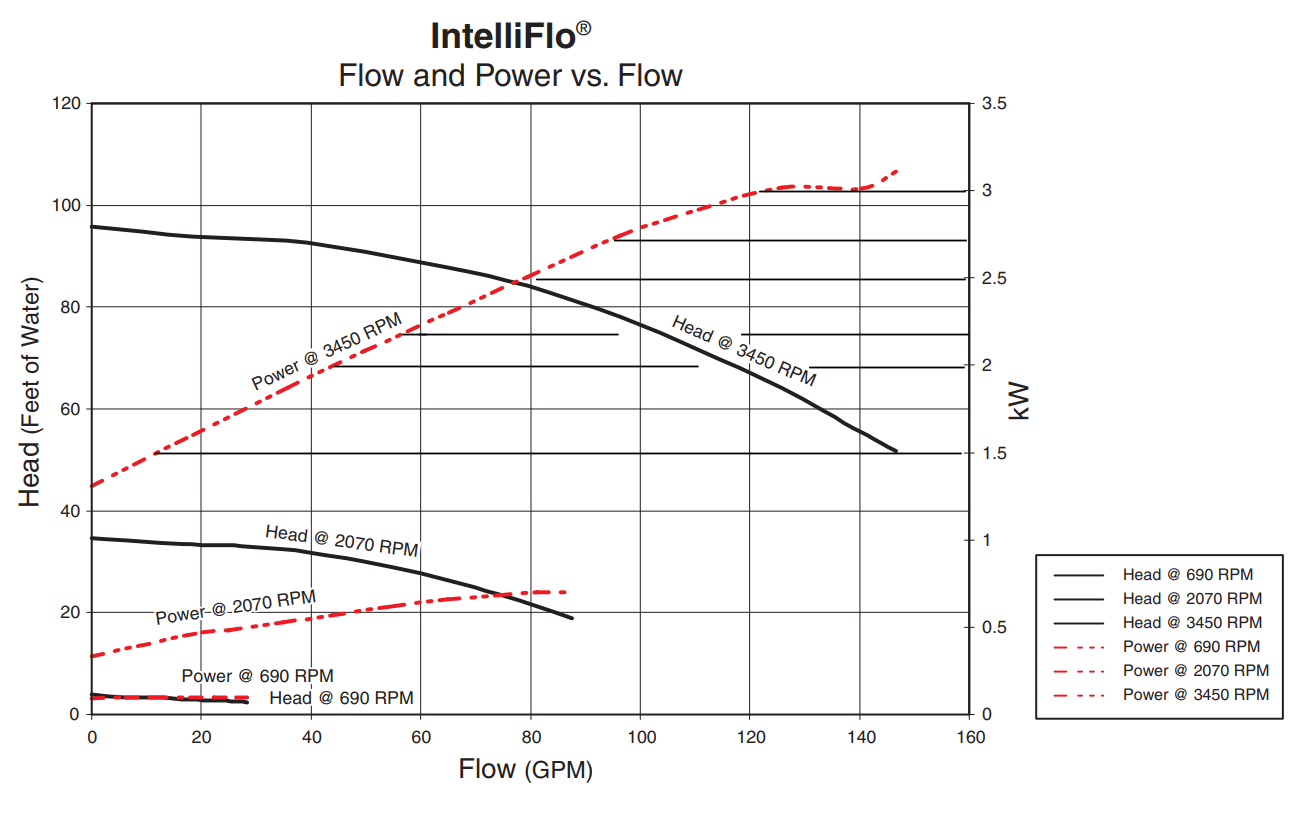
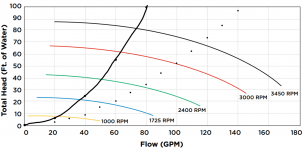
Following is Haywards official Head Chart for the EcoStar SP3400VSP
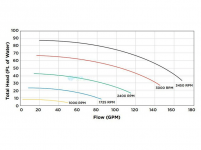
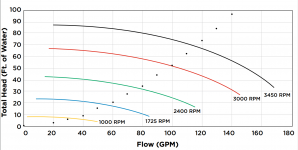
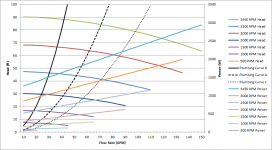
Here is my recreation of the above chart created by capturing the data points and plotting them. There are some differences, but overall it matches decently.
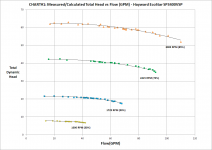
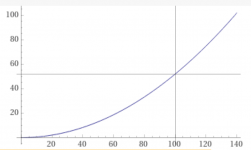
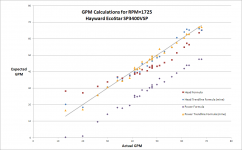
Next is the above graph with axes reversed, the GPM formulas for the trendline are displayed . These formulas are used to dynamically calculate GPM based on instantaneous PSI values obtained from the EcoStar. The main purpose of plotting these curves was to OBTAIN the formula for the GPM. Was there another way?
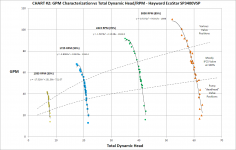
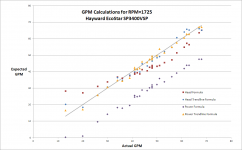
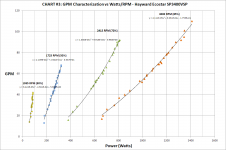
Similar to the last chart, but this one plots power usage (Watts) vs GPM so that GPM can be calculated dynamically from instantaneous watts usage from the EcoStar.
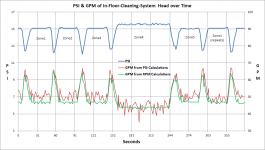
Finally here is a graph that that displays captured/calculated real time GPMs of the IFCS using the formulas from the charts above and the hardware/software that is in place. You can see that the operation of the IFCS changes pressures and GPMs fairly rapidly. Each tick on the time scale represents about 30 seconds. For those not familiar with how an IFCS works here is a simple explanation:
I have five cleaning zones (sets of valves that pop-up and blast water out) in my pool. One of my zones is implemented as a "double zone" (labelled Zone4) and that is why it is almost twice as long as the others. When the cleaning system transitions from one zone to the next, there are temporarily two zones "ON" at the same time. Thus pressure drops and the GPM increases until the next zone is fully transitioned into. The process of "popping up" the valves rotates them to the next position (to "sweep" a new part of the pool) and then the enitre process repeats.
I do have a few questions, but I didn't want to over-overload this post from the very begining, haha.
I DO have some methodology questions before moving ahead (including whether I should re-do some of the data captured), but I’ll ask those in a follow up if there is any interest.
Why do I want the ability to know my GPM dynamically? The main reason is that I am planning some efficiency/effectiveness experiments with my In-Floor-Cleaning-System that will manipulate a number of factors. To evaluate the effect of changing these factors, I need to record GPM (cumulative/instantaneous) and Power Usage (cumulative/instantaneous). But there are a few other reasons as well, one of which is that this has been educational and fun!
The hardware and software pieces that have allowed this experiment include:
- instantaneous PSI measurements/capture on the pool pump suction/pressure sides
- instantaneous pool pump power measurements/capture
- precise valve actuator movement and positioning
This post contains a few charts:
- official head curve chart for Hayward ECOStar pool pump
- next is my “recreation” of the above using data captured from my system
- the third is the inverse of #2 so that the formula/trendline for GPM can be derived in terms of Total Dynamic Head
- the fourth is similar to #3 except that the formula/trendline for GPM can be derived from power usage (watts)
- Finally, the last graph puts it all together and displays the GPM captured over time and shows it relation to what is going on inside the IFCS cleaning heads
Following is Haywards official Head Chart for the EcoStar SP3400VSP

Here is my recreation of the above chart created by capturing the data points and plotting them. There are some differences, but overall it matches decently.

Next is the above graph with axes reversed, the GPM formulas for the trendline are displayed . These formulas are used to dynamically calculate GPM based on instantaneous PSI values obtained from the EcoStar. The main purpose of plotting these curves was to OBTAIN the formula for the GPM. Was there another way?

Similar to the last chart, but this one plots power usage (Watts) vs GPM so that GPM can be calculated dynamically from instantaneous watts usage from the EcoStar.

Finally here is a graph that that displays captured/calculated real time GPMs of the IFCS using the formulas from the charts above and the hardware/software that is in place. You can see that the operation of the IFCS changes pressures and GPMs fairly rapidly. Each tick on the time scale represents about 30 seconds. For those not familiar with how an IFCS works here is a simple explanation:
I have five cleaning zones (sets of valves that pop-up and blast water out) in my pool. One of my zones is implemented as a "double zone" (labelled Zone4) and that is why it is almost twice as long as the others. When the cleaning system transitions from one zone to the next, there are temporarily two zones "ON" at the same time. Thus pressure drops and the GPM increases until the next zone is fully transitioned into. The process of "popping up" the valves rotates them to the next position (to "sweep" a new part of the pool) and then the enitre process repeats.

I do have a few questions, but I didn't want to over-overload this post from the very begining, haha.
Last edited:


