Dynamic GPM Calculations

jonpcar

Bronze Supporter
Jun 1, 2016
677
Gilbert, AZ
This has been a project that has been in the works (sporadically) for a couple years. A number of the parts have been in place for over a year but I have finally gotten around to start piecing it together. I’m posting this hoping I can catch a bit of attention from the pump gurus on the forum (haha) that can tell me if I am on an OK path. Believe me, over the last couple days, I have really made a bunch of stupid mistakes…but , I THINK, it is coming together better than I had hoped.

I DO have some methodology questions before moving ahead (including whether I should re-do some of the data captured), but I’ll ask those in a follow up if there is any interest.

Why do I want the ability to know my GPM dynamically? The main reason is that I am planning some efficiency/effectiveness experiments with my In-Floor-Cleaning-System that will manipulate a number of factors. To evaluate the effect of changing these factors, I need to record GPM (cumulative/instantaneous) and Power Usage (cumulative/instantaneous). But there are a few other reasons as well, one of which is that this has been educational and fun!

The hardware and software pieces that have allowed this experiment include:
- instantaneous PSI measurements/capture on the pool pump suction/pressure sides
- instantaneous pool pump power measurements/capture
- precise valve actuator movement and positioning

This post contains a few charts:
  • official head curve chart for Hayward ECOStar pool pump
  • next is my “recreation” of the above using data captured from my system
  • the third is the inverse of #2 so that the formula/trendline for GPM can be derived in terms of Total Dynamic Head
  • the fourth is similar to #3 except that the formula/trendline for GPM can be derived from power usage (watts)
  • Finally, the last graph puts it all together and displays the GPM captured over time and shows it relation to what is going on inside the IFCS cleaning heads

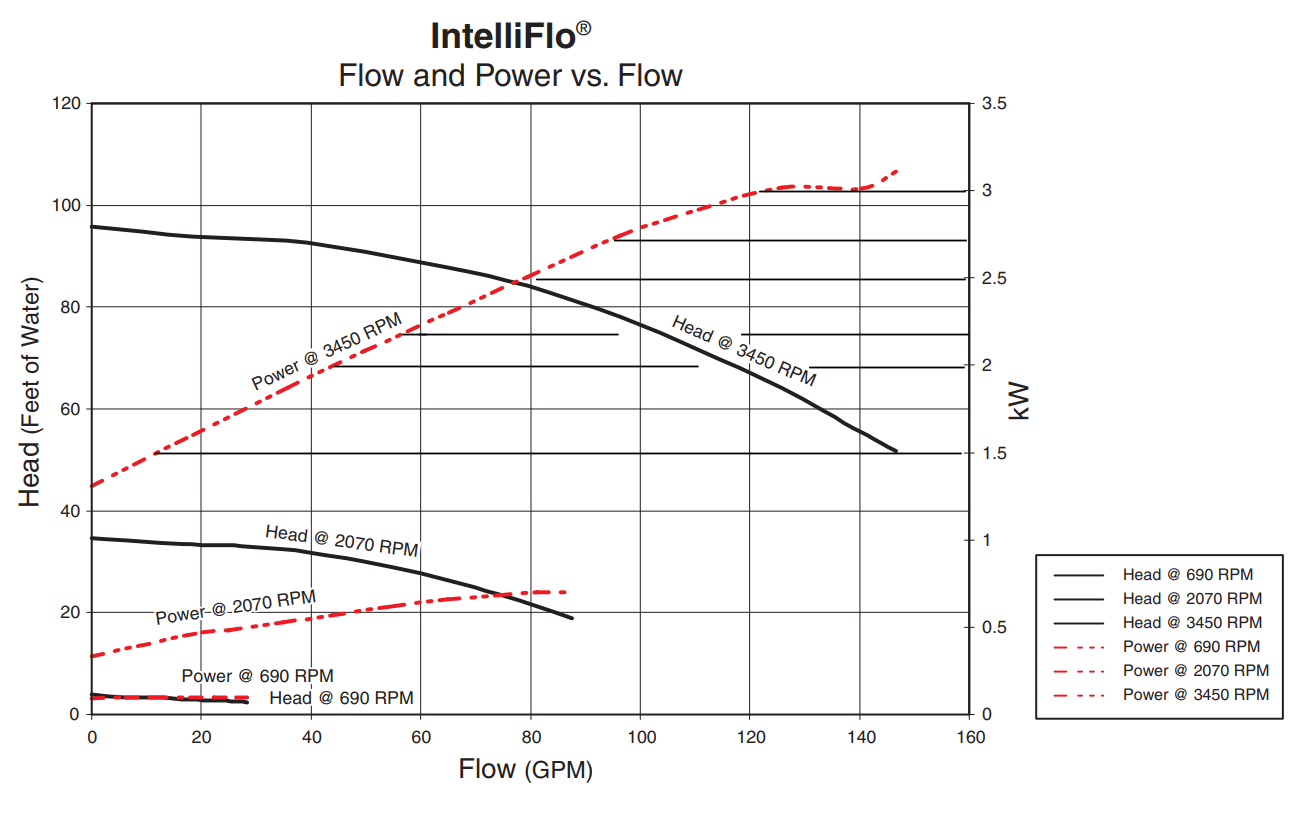
Following is Haywards official Head Chart for the EcoStar SP3400VSP
1625349991265.png
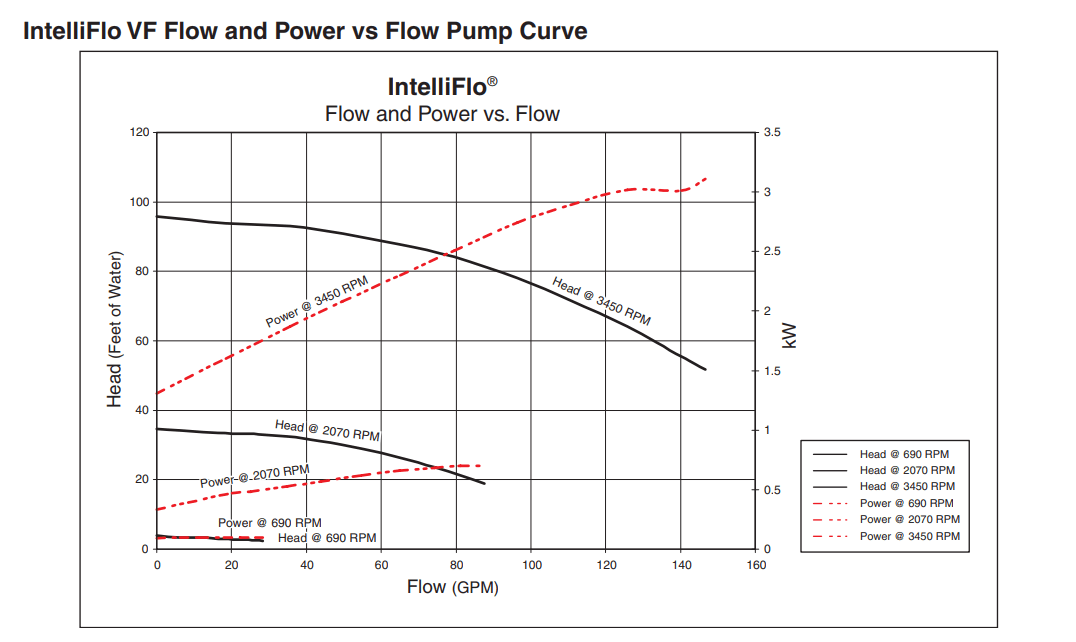
Here is my recreation of the above chart created by capturing the data points and plotting them. There are some differences, but overall it matches decently.

1625350110049.png

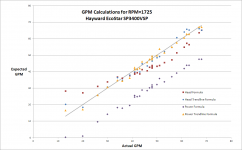
Next is the above graph with axes reversed, the GPM formulas for the trendline are displayed . These formulas are used to dynamically calculate GPM based on instantaneous PSI values obtained from the EcoStar. The main purpose of plotting these curves was to OBTAIN the formula for the GPM. Was there another way?

1625350362505.png

Similar to the last chart, but this one plots power usage (Watts) vs GPM so that GPM can be calculated dynamically from instantaneous watts usage from the EcoStar.

1625350504050.png

Finally here is a graph that that displays captured/calculated real time GPMs of the IFCS using the formulas from the charts above and the hardware/software that is in place. You can see that the operation of the IFCS changes pressures and GPMs fairly rapidly. Each tick on the time scale represents about 30 seconds. For those not familiar with how an IFCS works here is a simple explanation:

I have five cleaning zones (sets of valves that pop-up and blast water out) in my pool. One of my zones is implemented as a "double zone" (labelled Zone4) and that is why it is almost twice as long as the others. When the cleaning system transitions from one zone to the next, there are temporarily two zones "ON" at the same time. Thus pressure drops and the GPM increases until the next zone is fully transitioned into. The process of "popping up" the valves rotates them to the next position (to "sweep" a new part of the pool) and then the enitre process repeats.

1625351392889.png

I do have a few questions, but I didn't want to over-overload this post from the very begining, haha.
 
Last edited:
A pump's head curve is a parabolic curve so it can be modeled, to a reasonable approximation, in the following form:

H = Hm * ((rpm/3450)^2 - (Q/QM)^2)

Hm is the head axis intercept and QM is the flow rate axis intercept, if it did intersect. Q is the operating point flow rate in GPM & H is the operating point head in feet.

So you can easily invert this equation to be:

Q = Qm * sqrt((rpm/3450)^2 - H/Hm)

For the EcoStar, calculated from EnergyStar measurements, Hm = 90.3 & Qm = 273.8

However, this was fit to only 3 data points, Plumbing Curve A, B & C but it should be close enough. But you can plot it over your data and see if you need to make any mods.
 
  • Like
Reactions: jonpcar
Thanks for the reply Mark. I’ll try to overlay that formula over my data and see how it compares.

I do have a question about the GPM calculation method using power (watts) measurement. Based on what I have done so far, it seems to me that this method is much more predictable/repeatable/accurate in a system that has pressure spikes…like my IFCS seems to have. Would you agree with that or is there something I am missing? Do you have a similar ecoStar formula (like the one in your reply) that uses power (watts) as a basis to calculate dynamic gpm?
 
The head curve model is much better at predicting GPM than the power curve because the power curve is fairly flat with GPM so a little error in watts results in a big error in GPM. While the head curve, in the area of most plumbing systems, has a fairly steep slope (compared to the watts). But here is the formula you can use for the watt/GPM relationship.

Watts = WA * GPM * (RPM/3450)^2 + WB * (RPM/3450)^3 + WC

Rearranging for GPM,

GPM = (Watts - WB * (RPM/3450)^3 - WC) /(WA * (RPM/3450)^2))

For the EcoStar, the coefficients are as follows:

WA = 12.02
WB = 1107.08
WC = 40.84

Note that these coefficients have specific meaning. WA is the watts/GPM slope along the head curve, WB is the dead head wattage and WC is the drive wattage (i.e. 0 RPM).

Both the head curve model and the wattage model are based upon the underlying physics of the pump rather than an arbitrary curve fit so they help smooth out measurement errors.

These coefficients are also available for other pumps here:

 
  • Like
Reactions: jonpcar
If you want to find your system curve and plot it on the same graph as your pump performance curve, you can find the total head loss and the flow in gpm at different flow rates and plot them on the same graph.

If you know the speed and either the flow or head loss, you can plot the point.

https://aquamagazine.com/service/how-to-read-pump-system-curves.html

You can find the system curve formula as y=KX^2 where K= head loss at a point divided by the flow rate squared at that point.

For example, if your system was 300 feet of 2" pvc pipe, the system curve would look like the below graphed on the pump performance curve.

For example, at 100 gpm, the total head loss is 51.932.

So, y = 0.005132X^2

1625422363126.png


1625421735911.png
1625421719238.png
 
full


full
 
Plumbing curves are only applicable for a static plumbing system. This system is constantly changing due to the in-floor valve rotation so the plumbing curve is actually constantly changing with time as can be seen by the PSI vs time chart above. For each time slice, you could recalculate the plumbing curve but it is a bit redundant because the pump head curve equation that I gave does basically the same thing except it accounts for the changes along the head curve as well so it is good for all plumbing curves.

BTW, those head curves are for the Intelliflo not the EcoStar. Head/power curves for the EcoStar

1625425788662.png
 
Last edited:
  • Like
Reactions: JamesW
Why do I want the ability to know my GPM dynamically? The main reason is that I am planning some efficiency/effectiveness experiments with my In-Floor-Cleaning-System that will manipulate a number of factors. To evaluate the effect of changing these factors, I need to record GPM (cumulative/instantaneous) and Power Usage (cumulative/instantaneous). But there are a few other reasons as well, one of which is that this has been educational and fun!
I believe the OP is trying to make an in-floor more efficient which is no easy feat.
 
  • Like
Reactions: JamesW
The in-floor has certain operating parameters as specified by the manufacturer.

While staying within those recommended parameters, they would try to find the optimal effectiveness at the lowest speed.

Knowing the power is probably not going to make any difference in deciding the operational parameters.

Essentially, you want to go as slow as possible while still achieving the desired result.
 
  • Like
Reactions: mas985

Enjoying this content?

Support TFP with a donation.

Give Support
This might put some things in context:


The OP has been at it for some time.
 
I see there has been some activity in this thread while I was writing this post...haha. Thanks for the comments James! I haven't had a chance to look through it yet, but I will go ahead and post this.

Thanks again, Mark. So I plugged the data into the formulas. I currently have four different formulas to calculate the GPM:

(1) Head formula
(2) Head Trendline Formula (mine)
(3) Power Formula
(4) Power Trendline Formula (mine)

Here is what I am struggling to understand...my data and results are going to match fairly close because the trendline formulas were developed FROM the actual data, I'm not sure if that is valid...especially since I didn't really put the effort in to make sure that the baseline data (to get the trendline formula) is immune from the noise, especially in the psi measurements.

But I'm also struggling to understand how one formula (with one set of coefficients) could be accurate across all pump rpms. Is the goal so that it is accurate for a portion of the usable/normal ranges of operation? Especially those parts of the curve with significant slope?

Here's what I came up with, this chart shows the comparison of the various "formulas" for RPM=1725. I looked at the others as well and the results are similar. The ideal GPM calculation is the line...where the Calculated GPM calculation exactly matches the Actual GPM. So...there is either a problem with my data, or the standard formula calculations don't seem to match very well. I feel that the GPM readings from the flowVis are very accurate except at the 90+ gpm range. I'm also pretty confident that the PSI and watts reading are in the ballpark.

1625426130406.png


Here is the underlying data if you notice that something seems terribly wrong:
ABCKLMOVWX
PSIvPSIpWattsTotal Dynamic HeadRPMActual GPMHead Formula GPMHead Trendline GPMRPM Formula GPMRPM Trendline GPM
30​
-0.369180
21.62​
1725​
13
28​
20​
0​
16​
31​
-0.478.92182
21.69​
1725​
20
27​
18​
1​
17​
32​
-0.478.8208
21.41​
1725​
26
31​
26​
10​
26​
33​
-0.638.55222
21.20​
1725​
30
34​
31​
14​
31​
34​
-0.738.34234
20.94​
1725​
34
37​
36​
18​
35​
35​
-0.668.44233
21.01​
1725​
36
36​
35​
18​
34​
36​
-0.788.26238
20.88​
1725​
39
38​
38​
20​
36​
37​
-0.818.19253
20.78​
1725​
41
39​
40​
25​
41​
38​
-0.848.13256
20.71​
1725​
41
39​
41​
26​
42​
39​
-0.888.09254
20.71​
1725​
42
39​
41​
25​
42​
40​
-0.918.09255
20.78​
1725​
43
39​
40​
25​
42​
41​
-0.997.9266
20.53​
1725​
44
41​
45​
29​
46​
42​
-1.047.88265
20.60​
1725​
46
41​
43​
29​
46​
43​
-1.067.77270
20.39​
1725​
47
43​
47​
30​
48​
44​
-1.087.7275
20.27​
1725​
48
44​
49​
32​
49​
45​
-1.117.7272
20.34​
1725​
48
43​
48​
31​
48​
46​
-1.087.77270
20.43​
1725​
48
42​
46​
30​
48​
47​
-1.187.62276
20.32​
1725​
50
43​
48​
32​
50​
48​
-1.217.57287
20.27​
1725​
51
44​
49​
36​
54​
49​
-1.227.48281
20.09​
1725​
53
45​
52​
34​
52​
50​
-1.377.25290
19.90​
1725​
56
47​
55​
37​
55​
51​
-1.496.91297
19.39​
1725​
58
51​
61​
39​
58​
52​
-1.586.63305
18.95​
1725​
61
55​
64​
42​
61​
53​
-1.656.42311
18.63​
1725​
62
57​
66​
44​
63​
54​
-1.626.5311
18.74​
1725​
63
56​
65​
44​
63​
55​
-1.925.75322
17.70​
1725​
67
64​
66​
47​
67​
56​
-1.975.6322
17.47​
1725​
68
65​
65​
47​
67​


And just in case there is something really wrong, the formula is probably where I messed up:

Head Formula =273.8*SQRT((POWER(M30/3450,2)-L30/90.3))
RPM Formula = (D30-1107.8*(POWER(M30/3450,3)) - 40.84)/(12.02*POWER(M30/3450,2))
 

Attachments

  • 1625426029358.png
    1625426029358.png
    16.4 KB · Views: 0
This might put some things in context:


The OP has been at it for some time.
Oh Mark...did you have to post that? Haha...too much information. I've also learned a few thing since then...like the power numbers from my EcoStar are not even close...especially at lower RPMs.

Actually, since that series of post and the changes I made to the system...I have been really happy with my IFCS and it cleans great for $20 month in total pump electric costs...I never returned to the exercise of lowering that to $10...I got bogged down in other things. Thanks again Mark for your help in understanding what the heck I was doing back then.
 
Last edited:
But I'm also struggling to understand how one formula (with one set of coefficients) could be accurate across all pump rpms. Is the goal so that it is accurate for a portion of the usable/normal ranges of operation? Especially those parts of the curve with significant slope?
Because of the pump affinity equations make it so. The head curve is scaled by the RPM change so each GPM and Head values scale:

GPM2 = GPM1 * (RPM2/RPM1)

Head2 = Head1 * (RPM2/RPM1)^2

Note too the pressure gauges are not all that accurate. They generally have a 1-2 PSI error through the entire range so low PSI measurements are worthless. So you are best off doing all your measurements at nearly full speed and then using affinity equations for other speeds. It isn't surprising that the equations don't match for 1725 RPM. Do you have measurements at full speed? BTW, how are you determining "Actual GPM"?

Also, if you are capturing the pump pressure and suction at the pump through the drain plugs, then those will be a little different than the energy star measurements where they measure at the inlet and outlet of the pump. The published head curves should be referenced to the inlet and outlets of the pump. But if you are only interested in getting close, the the drain plugs are fine.
 
For each zone, the flow seems to be about 47 gpm and the head loss is about 35 feet (15 psi). So, the system curve can be approximated to be about y=0.0158X^2.

Based on this, the speed for operation should be about 2,230 rpm, is that correct?

1625428486254.png

1625428181900.png
 
Last edited:
Sorry guys, I'm juggling a few things today around the house. Thanks for the comments. James...it takes a while for me to digest things as Mark can testify too. I'll do my best to keep up.

The in-floor has certain operating parameters as specified by the manufacturer.

While staying within those recommended parameters, they would try to find the optimal effectiveness at the lowest speed.

Knowing the power is probably not going to make any difference in deciding the operational parameters.

Essentially, you want to go as slow as possible while still achieving the desired result.

Unfortunately, the desired result (a clean pool at the lowest cost) is very hard to measure. I was trying to avoid getting too much into the IFCS discussion in this thread but IFCS requires high pressure to "stir up the debris", but at the same time you are trying to filter out that debris when you are running at a very inefficient, expensive, and relatively low gpm. I believe it would be much better (and cheaper) if you could stir up all the debris and immediately switch to run at a filtering speed that is much more efficient. That's the general idea of where this is headed. BUT I want to measure the efficiency of each attempt.

Keep in mind...this is just a hobby...I don't think anyone else is going to try this, haha.

The goal of this particular project is to get a number for the efficiency (Power Factor) for the operation of my IFCS over its "use in a day", I've been running it 3 hours/day for the last couple years. And then I will try some experiments to improve that efficiency.

For each zone, the flow seems to be about 47 gpm and the head loss is about 35 feet (15 psi). So, the system curve can be approximated to be about y=0.0158X^2.

Based on this, the speed for operation should be about 2,230 rpm, is that correct?

The PSI graph I posted was an simply an example (not necessarlily typical operation), but I think it was at 70% max RPM, so 2415.

At what speed and flow do you get the best performance from the in-floor system?

I've been running at 70% max (2415) for the last couple years...but some of the flow has been directed "around" the IFCS (with a bypass valve) to increase overall GPM so that more water is filtered WHILE the IFCS is running. That's pretty much the result of that long discussion thread that Mark posted a link to. I can honestly say that my pool has never been cleaner than in the prior 23 years after making that change...and cheaper than I had ever run it before. A big part of that was simply using the VSP that I had installed a couple years prior to its max advantage.
 
As I mentioned in the other thread, filtering the water body is huge waste of energy. If you focus on skimming and cleaning the bottom, that should keep your pool just as clean without unnecessary energy use.
 
Note too the pressure gauges are not all that accurate. They generally have a 1-2 PSI error through the entire range so low PSI measurements are worthless. So you are best off doing all your measurements at nearly full speed and then using affinity equations for other speeds. It isn't surprising that the equations don't match for 1725 RPM. Do you have measurements at full speed? BTW, how are you determining "Actual GPM"?

Also, if you are capturing the pump pressure and suction at the pump through the drain plugs, then those will be a little different than the energy star measurements where they measure at the inlet and outlet of the pump. The published head curves should be referenced to the inlet and outlets of the pump. But if you are only interested in getting close, the the drain plugs are fine.
Mark, I picked up a bunch of these PSI gauges on eBay for cheap ($17 each), and although used, they work very well. These gauges (after a one time adjustment in software) read at almost zero (+/-0.1) consistently when the pump is off. I don't have any numbers at full speed...I haven't run at that for years, in fact my max ecoStar speed is set to 85% max. I can post the graph for the 85%, but if you really want to see the full speed one, I probably won't get to it for a while.


"Actual GPM" is physically read from a FlowVIS. All the other data is automatically captured.

As I mentioned in the other thread, filtering the water body is huge waste of energy. It doesn't accomplish anything. If you focus on skimming and cleaning the bottom, that should keep your pool just as clean without unnecessary energy use. Turnover is useless.
Yes, I have definitely taken advantage of the low cost, very efficient skimming using the wall returns. Unfortunately, as we talked about in the other thread, there are many IFCSs that don't have that option.

As far as "cleaning the bottom", you are talking mostly about about debris that gets pushed around the bottom by the IFCS...that doesn't necessarily include all the floating stuff that gets kicked up and suspended for some amount of time (dirt, pollen, palm frond hairs, small leaves, etc). One thing I definitely have learned about my IFCS, it spends WAY too much time blasting out water in each zone. Most IFCSs have no ability to control that "zone time", by mine does to some degree and I have taken advantage of it.

Anyway, I have a couple of things to look at...I want to see if the PSI values read on the fringes can be stabilized at all by taking more samples/averaging longer. Currently I sample each PSI sensor 8 times over a half second and average them together. I am not happy that the gpm numbers I am getting with your head formula are not closer when I plug in my captured psi numbers.

Thanks again...
 
I wouldn't mind taking a look at the raw data if you have it in Excel or Google sheets form.

The equations I gave you are based upon measurements done by the manufacture Huof the pump but it doesn't mean they were done right. In several cases, I found numbers that were clearly transposed and sometimes the data from the various sources (CEC vs APSP vs EnergyStar) show different results for the same pump. I prioritize the data based upon my best guess as who I think has the best data. When someone has done a comprehensive test such as yourself, it is worthwhile to compare it to this data.
 

Enjoying this content?

Support TFP with a donation.

Give Support
Thread Status
Hello , This thread has been inactive for over 60 days. New postings here are unlikely to be seen or responded to by other members. For better visibility, consider Starting A New Thread.