CYA vs UV Chlorine Loss Test – Observations

My apologies to any all who have followed my postings with resulting confusion and/or frustration with my ignorance, sometimes amplified by some of my muddled explanations. I'm sure there are many members with vastly more knowledge and ability than I in chemistry and mathematics for whom my ignorance could lead to frustration.

I should have clearly stated where I was coming from and what I was hoping to learn, and the approach I had taken to find some answers for myself.

What I wanted to find out:
How can I figure out, under whatever combinations of CYA, FC and pH, what percentage (fraction) of each Mole of chlorine in the pool is in the forms of HOCl and OCl-? How do those results change as you change those conditions? Allowing me then to do some comparative analysis. For me, this is not a purely scholarly pursuit. The answers to my questions will help my decision making in operating our 2 semi-public pools, hopefully better, more efficiently and economically. And within County Health Code operating boundaries.

So - Research the problem. I quickly found some guideline estimates like "98% of the chlorine is bound to CYA", approximately 50% unbound chlorine at pH 7.5 is in the form of HOCl. I read, downloaded a lot of information I located that ChemGeek had posted on TFP, as well as from other sites or referenced documents online, that might be applicable and analyzed that info. Read and downloaded a lot of basic research papers, including the O'Brien papers, that presented elements that I felt were relevant to swimming pools, and try as best I could to understand those. Most of the time having to Google for terminology definitions, chemical reactions, etc.

Anyway, after many untutored attempts at calculating (in other words, getting myself wrapped around the axle), I happened upon the EPA (Wahman) calculator app. Aha! Thought I.
However, the app generates all its values as the negative Log of the molar concentrations (mol/l) at the given conditions. OK. I'll presume they're accurate, as they're based on the prior work of O'Brien, et al. Now, how to separate out just the fractional molar relationships from the concentrations?

Ultimately, I figured out a way to derive the Molar Fraction from the negative Log of the Molar Concentration, at least for total free chlorine, HOCl and OCl-. For all the rest, I'll have to learn how to use the negative log molar concentration values directly. That is, if I ever really need to know something like what fraction of each initial mole of TriChlor (Cl3CY) in solution is in the form of H2ClCy under various conditions.

Being able to calculate the Molar Fractions at different FC, CYA and pH conditions, allowed me to solve, at least for myself, how and why Mark's test results came out as they did, and the implications of that for our pool operations.

Thanks for your patience.

Hi Tom,

Thank you for sharing, there are not too many people that would have the time or patience to dig as deep as you have, most just want to jump in and relax. I kept thinking ”but why”, and then there it is. But I’m thinking maybe it would be easier to approach this in a less precise manner using historical data.

Its like your trying to count and separate sand grains by size in a sand storm in order to ensure there is more of one size than the other according to a theoretical ratio that is constantly affected by random deviation. A wise man once said, actually it was Jim from above, that it is more like a game of grenades then a game of darts. Pools never reach equilibrium, they are always in state constant change and our testing lacks the precision to be super precise. And for most of us that level of precision is just not needed anyway. Any test is just a snap shot in time at that precise moment, it doesn’t tell us an enormous amount about where the pool was a week ago and where it will be in a weeks time.

There is also a major lack of literature and research. I looked though an old first year chemistry text book and in over 1200 pages the term cyanuric acid doesn’t even appear once. And I could probably count on one hand the number of published articles relating to cyanuric acid and the relationship to FC. Its sad to think that we know more about so many obscure things that are mostly meaningless to the general public then we know about the simple interaction of a handful of chemical species in the average backyard pool that is part of one of the largest industries worldwide.

Having said that it does appear that the pool industry (domestic and commercial) lacks the people who are willing to think outside of the box, to test the boundaries and to achieve more, so knock yourself out, dig as deep as your willing. 👏:)
 
Please explain how that could be when the spreadsheet shows nearly the reverse results. I'm a firm believer in Actual, reasonably controlled empirical test results. Then I try to figure out why there is a discrepancy between the theoretical result and the empirical test result.

And please don't introduce depth of water. All three of mark's test samples were in rather shallow, clear-walled, open vessels. Other than FC and CYA concentrations, the test conditions of temperature and sunlight exposure were identical.

This is where the pier review part of publishing comes in handy. While we are thankful that Mark took the time and posted the results, the results pose some interesting questions and could even lead to some variations to the spread sheets but there would need to much more work done to get to that stage. If the results were to be journal published the experiment would have to be done again, in bigger vessels, repeated, about a hundred times, with more sophisticated monitoring equipment and by a few more unrelated people doing it in parallel. And after all that work there is always the possibility of something we didn’t think about.

Unfortunately there will always be variation between theoretical and actual. If you add 10% variance to the speed sheet I guess you would be within the ball park.
 
  • Like
Reactions: mgtfp
There is a post explaining how to use the spreadsheet:


Be very careful not to add any lines, otherwise the underlying scripts might not work any more.

How are you calculating the chlorine decay? Are you considering that OCl - has a shorter half life than HOCl?

I trust Chem Geek's sheet to give the correct concentrations, and V 0.5 of Wahman's tool should give the same concentrations if both tools are used correctly. V 1.0 will give concentrations at pool relevant FC/CYA ratios that are different, I would not use this version.

That's what I meant when I said that you shouldn't be able to reproduce Mark's test results with both tools, Richard's or Wahman's. Based on pure fractions of chlorine attached to CYA, you would not expect the huge effects that Mark saw in his experiments.

And I think you also have to take Mark's experiments with a grain of salt. He's put great effort into them and done a good job. But it's not a laboratory test. All the drop tests have their resolutions, and so on.

You also have to be very careful to not have pH effects interfere. Most are not aware of this, but pH has quite an effect on chlorine decay. At higher pH you have more OCl - which decays much faster than HOCl under UV. TFP teaches that with CYA you can neglect the pH dependency of the HOCl. This is simply because you have to look at the ratio of HOCl to the total FC (which is mainly chlorinated Cyanurates). But the equilibrium between HOCl and OCl - still remains. Above pH 8, you still have a lot more OCl - than HOCl, but when following TFP's FC/CYA recommendations you still have enough HOCl, even at pH 8.1 or so.

You need to be very careful to conduct all these tests at exactly the same pH and know FC and CYA sufficiently precise. This is not an easy task.

Based on the FC-CYA equilibriums we don't understand why FC protection at higher CYA is so much more efficient. But based on the experience of thousands of TFP members, these effects seem to be real. There do seem to be additional effects, that we haven't fully understood.

But we still need to be mindful that the plural of anecdote is not data. Just because FC suddenly jumped up after adding CYA, this is not proof of the overproportional UV protection. Of course FC jumps up (when keeping the SWG on the same settings) after increasing CYA, at least until you reach the same FC/CYA ratio again, accelerated more by the pH reduction that comes with adding CYA. It is difficult the get the real data out of these anecdotal reports in forum posts.

To really get to the bottom of it, long term testing would be required. Maintaining defined conditions at different CYA levels, but the same pH, FC/CYA, temperature, and UV-exposure. Get average chlorine consumptions over a whole summer. Not an easy feat.

Mark's experiments give us an indication that there are effects beyond the chemical equilibrium effects, but I wouldn't take the test results as the full and only truth.

The main truth that we have is that thousands of TFP SWG-pools are running more economical when maintaining higher CYA. But my understanding is that we haven't fully understood why this is the case. But we gladly take advantage of the benefits of higher CYA in SWG-pools. Non-SWG pools we prefer to keep SLAMmable without draining.
 
Here are some of Richard's calculations, that might help as a benchmark:

 
My thanks to AUSpool and mgftp for your comments.
The .04 was erroneously entered by me, when I had intended .4. It's not "somewhere between". Ha Ha.

About all I can say is that when theory doesn't match reality, it's time to revisit the theory. Particularly if you have any confidence that the tests were conducted with at least some degree of competence, which I have no reason to doubt that Mark employed to the best of his ability with the tools he had available.

I'm very aware that the FC/CYA concentration and the pH of solution both play very substantially in the amount of chlorine that is exposed to UV, thereby increasing or reducing its loss. For instance, moving from 7.5 pH to 7.7 pH will increase the FC loss rate, at whatever FC/CYA ratio, by 1.86 - 1.88 times, as that's the increase in the exposed percentage (fraction) of Free Available Chlorine unbound from CYA.

And I'm not trying to "count grains of sand" - I'll leave that to the PhD chemists and their spectrophotometers, etc., but I can identify a sand dune from a small accumulation of sand on the boardwalk.

I'm not looking to be precisely on target in my novice calculations. I'm just trying to reasonably validate the pool chemistry relationships. If I can repeatably get "close enough for government work", I'm happy.

I have used Dr. Wahman's EPA calculator along with the chlorine photolysis extinction rate constants for HOCl and OCl- presented by Nowell, L.H. & Hoigne in their paper "Photolysis of aqueous chlorine at sunlight and ultraviolet wavelengths - 1. Degradation Rates". I don't have a full copy of that paper, just the summary Introduction, but it states that they also investigated the effect of depth of water on the chlorine extinction rate, which could be somewhat useful additional information. I'm more interested in the first 12 inches where the majority of the loss occurs. Similar to CO2 outgassing which occurs at the water's surface-to-air interface.

They also did another paper, "Photolysis of aqueous chlorine at sunlight and ultraviolet wavelengths - 2.", which looked at the evolution of Hydroxyl Radicals and other Radicals by photolysis, which is relevant to Advanced Oxidation Process (for instance in wastewater treatment) and in atmospheric chemistry (OH* reacting with atmospheric methane, and such). A very different topic, but not irrelevant to oxidation of pool organics, although I don't know to what degree. Interesting topic though.

In any event, I have closely ("for government work") replicated Mark's test results to my satisfaction utilizing the combination of the "log_concentration_molar", and fractions thereof for HOCl and OCl-, from Dr. Wahman's calculator, along with the Nowell/Hoigne rate constants for HOCl/OCl- degradation (extinction). My calculation results (so far) using that combination of sources was:
At FC/CYA 7.2/80, a calculated loss of 0.4685 ppm FC over 2 hrs.
At FC/CYA 3.6/40, a calculated loss of 0.9605 ppm FC over 2 hrs.
At FC/CYA 3.6/40, a calculated loss of 1.882 ppm FC over 2 hrs (somewhat an outlier from Mark's test).
Which are not too divergent form Mark's empirical test results of .4, 1 and 1.4 FC loss, and which I believe should be taken seriously. And Mark's test results are "close enough for government work" in my view.

My point is -- Look at the pattern. Does the "theoretical" output of other calculations anywhere near match the empirical test results? A resounding No.
The "pattern" clearly shoes that halving the CYA concentration results in a doubling of chlorine loss, and a quartering of CYA results in quadrupling of chlorine loss. Look familiar? Sure does to me.

As I mentioned before, I'm a patterns and associations type of analyst. I'm not a whiz-bang mathematician. If I think there is a repeating pattern or a tell-tale series of associations in the data, I try to dig deeper to understand the Why of it. The mechanisms that determine the outcomes.

Should additional empirical tests be conducted to validate? Sure.
Do they need to be full blown lab tests? Why? Nowell & Hoigne got it resolved to a substantial degree already with their full-blown lab equipment. You can probably find other research papers that diverge from their results, which would not be surprising, but not to the degree of refuting them entirely.

Additional empirical tests don't even need to replicate Mark's original conditions. Whatever the conditions might be through structured multiple dilutive samples, tested with calibrated pH meters and fresh FAS-DPD test reagents should be sufficient. Doesn't really matter where you are in the country or what time of year you perform the tests. Admittedly, the more intense conditions of mid-day summer sun in lower latitudes will amplify the results (more sun, more UV), making them easier to distinguish the FC losses in testing. Volume does not particularly matter, it's more a practical consideration. One-to-two liters is sufficient. One PPM in one liter of water is no different than one PPM in 10,000 liters. The volume of the samples does not matter - only that each prepared test sample be exactly-as-possible the same volume and that the initial supply is drawn from a single source at a single point in time. And don't leave the water in the sun while you try to prepare the test.
 
I do believe that the CYA-FC equilibrium equations with O'Brien's constants give a correct description of the concentrations of HOCl, OCl- and the various chlorinated and unchlorinated Cyanurates. I also believe that the UV decay of HOCl and OCl- is well understood.

The Achilles heel is the assumption that CYA's UV protection of FC works in the simple way that every chlorine that is attached to CYA is fully protected, and only free HOCl and OCl- decay with their respective half life times.

The discrepancy between calculations based on this assumption (using the O'Brien model to get the respective concentrations and HOCl and OCl- decay constants as documented in the literature) and Mark's experiments shows that this assumption is not the full truth, there is more to it.

There seem to be additional UV protection mechanisms.

That's all I wanted to say, I didn't want to suggest that the O'Brien model is wrong. O'Brien didn't even want to describe how CYA protects FC from UV-decay, he "just" wanted to describe the concentrations of all the involved species and how that affects the bacterial efficacy of chlorine in the presence of CYA.
 
I totally agree.

I'm not trying to achieve absolute accuracy in my own calculations. I don't know that anyone at all has documented, through lab tests, the degree to which chlorine bound in the chlorinated-cyanurate subspecies is degraded by UV, but I think that whatever value might be attributed to it is at best an educated speculation. But I don't believe that it represents more than a very minor variance to the overall loss rate.

I'm not looking for precision in the computation of the chlorine loss, I'm looking at the relative magnitude of the loss from one step to the next through dilution: Initial condition, 1:1 dilution, 1:3 dilution. And I firmly believe that the magnitude of chlorine loss by UV is based in the exposed (unbound) HOCl/OCl- fraction of the total chlorine in the system.

I'm interested in the fundamental relationship.
When you cut the CYA to 50% of original concentration, the chlorine loss rate is nearly 2 times, at whatever initial FC/CYA ratio.
When you cut the CYA to 25% of original concentration, the chlorine loss rate is nearly 4 times, at whatever initial FC/CYA ratio.

Of course, Mark's empirical tests were made with practical day-to-day test reagents, perhaps questionable pH meter accuracy and potential test error, given the +/- .2 ppm accuracy of FAS-DPD. Additionally, I have no knowledge of the specific geographic location (specifically latitude), date of tests, atmospheric conditions, measure of solar UV flux during the test period, etc. Nor do I really need to know that - principally because I'm not trying to count the grains of sand. I'm just looking for the sand dunes.

Thanks for your input.
 
In case you haven't seen these yet, there are also some comments from Richard in his Chemistry thread:

See Figure 3 in this paper for some very decent absorption spectra for HOCl and OCl-. I've used that in a model that very accurately predicts chlorine consumption and is consistent with many measurements from other papers (except one that shows faster degradation). I'm well aware of the cutoff of the UV in sunlight and have that in a spreadsheet with that model.

Wavelength (nm): ............. 290 ........ 300 ........ 310 ........ 320 ....... 330 ........ 340 ........ 350 ....... 360 ........ 370 ....... 380
Irradiance (W/cm2-nm): 3.00E-10 2.00E-07 3.00E-06 1.50E-05 2.50E-05 2.70E-05 3.00E-05 3.00E-05 4.00E-05 3.00E-05

O'Brien's paper said nothing about any lack of applicability to swimming pools and we're talking equilibrium chemistry where it doesn't just stop occurring in different environments. Other additional equilibria can exist including ion pairs that can affect apparent solubility, but basic equilibrium chemistry doesn't vary by simply occurring with other chemicals in a pool. It is, of course, possible for there to be other chemicals in a pool that act like CYA forming weak bonds that affect the hypochlorous acid concentration, but in practice this isn't seen and indirect measurements of HOCl via ORP measurements or amperometric sensors generally track O'Brien's equilibrium constants. ORP is, of course, very noisy, but you can see in this post how in the second graph the calculated HOCl in real pools is correlated with ORP that is presumably most affected by it.

Now the one variation from O'Brien's paper that is very real is temperature. There is some info on that in this paper from Wojtowicz (see values for K7 and K9 temperature dependence). For swimming pools, this is a moderate effect, but it shows up more in hot spas. My Pool Equations spreadsheet has this temperature dependence turned off by default (around line 230 "Use Temp. Dependent Cl-CYA") because I'm not confident about the Wojtowicz data and using 77ºF constants is worst-case for pools and spas so is conservative.

As for the Sancier paper, I already had that, but that molar absorptivity of 0.2 peaking at 280 nm is too low though it would only take molar absorptivities of around 10-20 to explain the seen effect. So as I wrote, if it's not CYA shielding, then it's some other effect that acts in the same way and is as yet unexplained. It's absolutely an effect we've seen in many pools, especially the SWCG pools where chlorine introduction rates are much more regular so the "data" is far less noisy. 4 ppm FC at 80 ppm CYA loses less in sunlight than 2 ppm FC at 40 ppm CYA even though both have the same hypochlorous acid and hypochlorite ion concentrations (when the pH is the same in both cases). Don't forget that there also seems to be degradation of chlorine bound to CYA as well since the loss rate during exposure to sunlight far exceeds the theoretical calculated amount from the unbound CYA alone. So in theory, the 4 ppm FC should lose chlorine at almost twice the rate of 2 ppm FC, but in fact it loses less. If you have any explanation for this phenomenon, please let us know since we've never figured this one out.

I recently ran into Extended experimental investigation: The effect of sunlight on the chlorine levels in pools and noticed that Graphs 1 and 2 are much more consistent with chemical theory where Cyanuric Acid (CYA) hugely prevents chlorine degradation. The pH was not monitored (though a pH buffer was used), but we can still calculate relative rates of decline at different CYA levels to see if it's consistent with what we see in pools. We can calculate a decay rate constant based on C = C0*e-k*t. So, k = 1.16 for no CYA (though the 0.63 at 1 hour should be 0.78 for consistency with the data at other times), and using the 3 hour data we have k = 0.13 for 25 ppm CYA, k = 0.093 for 50 ppm CYA, k = 0.78 for 100 ppm CYA. This shows that there is chlorine loss beyond that from unbound chlorine and that higher CYA levels provide additional protection though not proportional to the CYA level.

That link was to a school's chemistry assignment assessment guide and student response example, but it looks like it was some student's actual data (it's too close to reality to be a fake response).

It would be very interesting to see what happens to the losses when the initial FC/CYA ratio is held constant. If no other mechanisms of protection were occurring, then increasing the FC proportional to the CYA level would result in noticeably higher absolute losses but we usually see the opposite. We presumed this was due to some sort of CYA (or chlorine bound to CYA) shielding effect, but that is a speculative guess. It remains one of the mysteries for which we do not have a definitive explanation.


Note especially the passages highlighted in red...
 

Enjoying this content?

Support TFP with a donation.

Give Support
I fail to see the need for accurate FC loss estimates based on ratios, theoretical calculations and/or varience to those calculations. The FC/CyA ratio is to ensure a minimum HOCl ratio to CyA in order to maintain adequate sanitation although for commercial use its more about limiting CyA for a given FC level. The primary function of the ratio is not to calculate FC loss. Although most of us are aware of a daily loss we mostly ignore it and just balance our SWG output or regular bleach doses to account for it.

Given the testing error and serial dilution errors in Marks test series I would think there would be little significant difference between Marks reported loss and your computed loss. Both quite neatly fit with the idea of diminishing FC loss rates with increasing CyA concentration as reported by Pickens here and here, both based on the original calculation by O’Brien. I don‘t see the need for a coefiecient or what that coefficient would represent or how it could add benifit to maintaining FC levels?

I had thought that commercial pools were required to limit and/or maintain FC and CyA according to the CDC’s model health code or operators handbook?
 
Last edited:
I fail to see the need for accurate FC loss estimates based on ratios, theoretical calculations and/or varience to those calculations
I fail to see how it could account for sun angle / UV intensity and various amounts of shade or cloud cover that affect outdoor pools. The variables turn the math on its side.

On paper, or in a lab, *this* sample will do *that* under this particular UV light. But in the real world, the light bulb changes throughout the day and season and is stronger some places while not in others. Tomorrow may not be like today. July and October drastically different most places. July and July are drastically different in the northern and southern hemispheres, or even between Michagan and Texas.

But I love the theory and discussion so carry on.

:epds:
 
  • Like
Reactions: AUSpool
I fail to see how it could account for sun angle / UV intensity and various amounts of shade or cloud cover that affect outdoor pools. The variables turn the math on its side.

This is actually not that difficult. That's the part that can be done without any deep understanding of the chlorine/CYA/UV chemistry/physics.

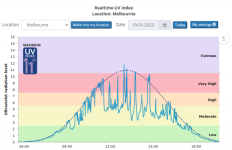
In Australia we have a UV-Index tracker:


This looks like that:
1682803050093.png

Ozone hole related, Aussies became quite obsessed with UV and proper "slip, slop, slap" ("Slip on a shirt, slop on sunscreen and slap on a hat"), which is probably why the government runs this website. Not sure if something similar exists for the US.

The data can be exported and imported into Excel. Then you just add the values (logged in minutes steps) up and get a measure for the cumulative UV load over a day. This intrinsically includes sun angle as it is measured for your location, and cloud coverage. Depending on how close you are to the measuring station, there will of course be differences in cloud coverage.

Shade above the pool you can just observe roughly for your pool and fit into a simple model with the height of an average object (representing trees, house, fence, etc) in front of your pool and the tan of the sun angle. The sun angle you can calculate from your latitude and the earth axis tilt, scaled with a sin-function over the year.

Like that I had fairly good success to correlate my observed chlorine loss (as a percentage of the FC-level) with the cumulative UV-load of a day. I didn't really calculate the chlorine loss theoretically, I was mainly interested to see how my chlorine loss roughly scales with UV-load.

Nothing of this is of course really "needed", but it can be fun to do for some.

You could also just log your SWG-output that is required to keep FC on average constant, create a table/plot of SWG-output vs. time of year, call it a day and enjoy a cold beverage. I find an overview like that quite helpful, as it tells me for example when after winter I have to start testing FC more often again and start ramping up the SWG.

To go beyond that and really understand exact CYA dependencies and stuff like that is more of academic interest and doesn't add much to real life pool maintenance. Not needed, interesting for some, considered pointless by others.
 
  • Like
Reactions: Newdude
This is actually not that difficult. That's the part that can be done without any deep understanding of the chlorine/CYA/UV chemistry/physics.

In Australia we have a UV-Index tracker:
Yes. But there would be many 'charts' needed to account for all the variations.

In my (limited) understanding of the advanced chemistry mission, OP is looking for a single gold standard equation/calculation/chart, which is thrown on its side from real-world conditions, times and locations.
 
  • Like
Reactions: AUSpool
I totally agree.

I'm not trying to achieve absolute accuracy in my own calculations. I don't know that anyone at all has documented, through lab tests, the degree to which chlorine bound in the chlorinated-cyanurate subspecies is degraded by UV, but I think that whatever value might be attributed to it is at best an educated speculation. But I don't believe that it represents more than a very minor variance to the overall loss rate.

I'm not looking for precision in the computation of the chlorine loss, I'm looking at the relative magnitude of the loss from one step to the next through dilution: Initial condition, 1:1 dilution, 1:3 dilution. And I firmly believe that the magnitude of chlorine loss by UV is based in the exposed (unbound) HOCl/OCl- fraction of the total chlorine in the system.

I'm interested in the fundamental relationship.
When you cut the CYA to 50% of original concentration, the chlorine loss rate is nearly 2 times, at whatever initial FC/CYA ratio.
When you cut the CYA to 25% of original concentration, the chlorine loss rate is nearly 4 times, at whatever initial FC/CYA ratio.

Of course, Mark's empirical tests were made with practical day-to-day test reagents, perhaps questionable pH meter accuracy and potential test error, given the +/- .2 ppm accuracy of FAS-DPD. Additionally, I have no knowledge of the specific geographic location (specifically latitude), date of tests, atmospheric conditions, measure of solar UV flux during the test period, etc. Nor do I really need to know that - principally because I'm not trying to count the grains of sand. I'm just looking for the sand dunes.

Thanks for your input.

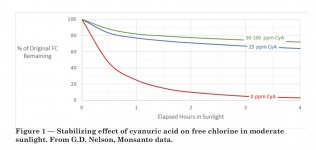
I think the relationship your interested in is depicted in the graph below but in reverse. From the graph, as you add CyA the greatest benifit from UV protection occurs within the first 0-25ppm CyA with diminishing penifit as you approach 100ppm CyA.

25528EBA-9384-433C-9820-F91F62F961B7.jpeg
From Stanley R. Pickens, 2023, Cyanuric Acid Requirement Versus Free Chlorine in Pool Water, in JSPSI.

And yes, the FC loss to UV is directly related to the unbound HOCl/OCl- although its mostly the OCl- ion that it affected by UV. However all species are in constant flux, that pesky flux capacitor thingy again. :) HOCl and OCl- are constantly interchanging and HOCl and CyA are constantly interacting which will always leave some OCl- exposed to UV degradation. Pickens noted that with CyA the HOCl/OCl- ratio is more greatly affected by the CyA concentration rather then pH. Indicating that the upper limits for pH could be extended to 8.5 with regard to maintaining adequate disinfecting levels of HOCl.

In theory this CyA graph tells us that there is little benefit from increasing CyA concentrations above 50ppm however in practice I found that increasing CyA from 50-70ppm resulted in a 1ppm FC increase over a week, enough to turn the SWC down a little. Theory and practice at odds but both still important.

None of this though explains the difference in cost structure from switching from pucks to bleach. Regardless of origin it is still the OCl- ion that is affected by UV and the dynamics the FC + CyA <-> FC + FC-CyA reaction remains the same. The FC loss to UV remains mostly “hidden” as we keep our FC input balanced to match the demand which includes the loss to UV.
 
Yes. But there would be many 'charts' needed to account for all the variations.

In my (limited) understanding of the advanced chemistry mission, OP is looking for a single gold standard equation/calculation/chart, which is thrown on its side from real-world conditions, times and locations.
Yes, it's more complex of course, depending on what you want to do. Just saying that there are relatively easy options.

To use it to verify a model, you first need that model. And not just in terms of UV, but also FC loss due to temperature dependent oxidation processes. And then normalise test results to standard conditions using UV data.
 
  • Like
Reactions: Newdude
To AUSpool:
Yes, we are "constrained" in our allowable operating conditions. To be within Code in Pima County, AZ, operating a semi-public pool, you're required to be within 1 - 5 ppm FC, 0 - 100 ppm CYA, and 7 - 8 pH. And the Code requires twice-per day testing. Public pools are required to test every hour. Both have to maintain test logs.

Just before I took over our pool operations, the county inspector had mandated the closure of our pools for not being code compliant, as well as being unsanitary. I later determined that the CYA had been somewhere above 500 ppm in each of our 2 pools. Each pool had experienced extensive green, yellow, black and "pink" algae (which is actually bacteria, not algae). Our community owners and residents were swimming in those sewers. Our maintenance staff (Pima County CPO Certified) were responsible for the pools & spas up to that point. Subsequently, I took the Pima County CPO course and assumed management of the facilities. In the Pima CPO course, 99% covered the physical equipment, drain protections and code-related fencing, gating, etc., and you can only use DPD testing for FC, must use "automatic" chlorinator, such as an adjustable-rate tablet feeder, no manual dosing and no pucks in the pool. As to pool chemistry, other than the above mentioned chemical parameters - nothing. Pitiful.

So, you could "legally" operate at 1 ppm FC, 100 ppm CYA and 8 pH. With those conditions, about 99.27% of all the chlorine would be bound to CYA and you would have about .0033 ppm HOCl and .0095 ppm OCl-. For comparison, at 3 FC, 30 CYA, 7.5 pH, you'd have about .0431 ppm HOCl. Which is 13 times the availabe HOCl at 1/100 FC/CYA 8 pH. When the county closed the pools, I think we may have been around 3.5/500+, and 7.3 - 7.4 pH. Disaster. And the county inspectors typically don't test the CYA when they visit, just FC and pH. They do, however, get quite upset if a gate is propped open or they can't see the bottom drain. Yeah, that might be a clue that something's wrong. :sneaky:
p.s., I am board president of our homeowners association.
 
  • Like
Reactions: AUSpool
Thank you AUSpool for your input. It clearly shows that you do understand the fundamental issue. Part of the following is an exercise in Logic using 2 excerpts from your recent posting with reference to Stanley R. Pickens:

"the FC loss to UV is directly related to the unbound HOCl/OCl- . . ."
"Pickens noted that with CyA the HOCl/OCl- ratio is more greatly affected by the CyA concentration . . ." Emphasis mine.

Particularly note, "unbound HOCL/OCl-", "and HOCl/OCl- ratio".

An allegory:
You have 10 people on a nudist beach in Brisbane on December 21 (solstice) at noon. What percentage (ratio) of their bodies will turn crispy in two hours? Maybe 100%?
You have 10 people on a golf course wearing long pants and long sleeved shirts in Brisbane on December 21 (solstice) at noon (crazy as that may sound). What percentage (ratio) of their bodies will turn crispy in two hours? Maybe 5% maximum?

Now ask: What percentage (ratio) of Free Chlorine will be destroyed by the very same solar UV on December 21 (solstice) at noon? Ans: The percentage (ratio) of the unbound chlorine (HOCL/OCl-).

Are we getting there yet? The percentage (ratio) of unbound Chlorine (HOCl/OCl-).

The above strikes a bell: If you reduce the level of CYA (ppm) shielding the chlorine from solar UV, the Chlorine loss will go Up. More Chlorine Undressed in the Sun! What's so very hard to grasp? We all agree. And, Mark's test results are darned near dead-bang-on in his side-by-side tests of chlorine loss under identical solar exposure conditions. Dilution from 80 ppm CYA to 40 CYA results in 2 times chlorine loss over 2 hours. DiIution from 80 ppm CYA to 20 ppm CYA results in 4 times chlorine loss over 2 hours. As my younger brother would say - "Easy peasy".

Perfectly logical results. However, PoolEquations.xls calculates a chlorine loss at 80 ppm CYA that is 2 times the loss as that at 40 ppm CYA. The direct opposite. WHY?

I think that part of the reason why folks are having difficulty excepting or following what I have been poorly trying to describe, due to my admittedly limited knowledge and capability, is that PoolEquations.xls is so darned Good. I've used it a lot, both for day-to-day as well as for some of my research purposes. A Huge Thank You! Just the amount of in-depth knowledge and mathematical prowess it represents is truly astounding. And therein lies the Problem. Because it is so Right, you can't believe that any part of it could be Wrong. And then, everyone starts trying to find reasons why Mark's test results can't possibly be true and my poor attempts at explanation are so much off from "reality?", and that the topic is so extremely complex and constantly in flux as to forever limit our understanding of it. All false assumptions.

In PoolEquations.xls, the calculated 1-hour chlorine loss, when you look at the method of calculation, (a series of Rates Constant), is essentially operating against 100% of the amount of chlorine present, in moles per liter chlorine - and mol/l is directly convertible to ppm: mol/l *70906 gives you ppm as Cl2. That's a How Many relationship. That is very much Not the same as the Percentage or Ratio of chlorine Unbound-from-CYA exposed to solar UV relationship.

Rate Constants are computed as against any 1 mole of chlorine, not All that are "on the beach" or "on the golf course", or total moles of chlorine in your pool. You could have 1, 10, 100, 1000 people on the beach and each One would get sunburned at the same rate. The "percentage exposure" of each One's body that has exposure to the sun is what matters, not how many people are there on the beach.

Therefore, when you have CYA in a pool, you first have to determine what Percentage (Ratio) of the chlorine is exposed to the sun. And it is that Percentage (Ratio) that the Rate Constant is computed against, not mol/l, in order to calculate the chlorine loss over a particular period of time.

Hopefully, some smart folks on the forum will look at this more fully. For me - I'm Done. No more postings from me on this particular topic. Thanks for all your information. And, it has been both educational Fun.
 
Once again, Oops. Correction:
"Now ask: What percentage (ratio) of Free Chlorine will be destroyed by the very same solar UV on December 21 (solstice) at noon? Ans: The percentage (ratio) of the unbound chlorine (HOCL/OCl-)." Should end: "Some percentage of the percentage (ratio) of the unbound chlorine (HOCL/OCl-." In other words, that would be the Rate Constant percentage against the percentage (ratio) of unbound chlorine.
 
To AUSpool:
Yes, we are "constrained" in our allowable operating conditions. To be within Code in Pima County, AZ, operating a semi-public pool, you're required to be within 1 - 5 ppm FC, 0 - 100 ppm CYA, and 7 - 8 pH. And the Code requires twice-per day testing. Public pools are required to test every hour. Both have to maintain test logs.

If it were me I would limit my CyA to 50ppm and run my FC at 5ppm. I assume there is a requirement for super chlorinating.

Good job on these pools. I love those FB HOA stories, do you have a golf cart with someone that goes around measuring the grass heights? :LOL:


So, you could "legally" operate at 1 ppm FC, 100 ppm CYA and 8 pH. With those conditions, about 99.27% of all the chlorine would be bound to CYA and you would have about .0033 ppm HOCl and .0095 ppm OCl-. For comparison, at 3 FC, 30 CYA, 7.5 pH, you'd have about .0431 ppm HOCl. Which is 13 times the availabe HOCl at 1/100 FC/CYA 8 pH. When the county closed the pools, I think we may have been around 3.5/500+, and 7.3 - 7.4 pH. Disaster. And the county inspectors typically don't test the CYA when they visit, just FC and pH. They do, however, get quite upset if a gate is propped open or they can't see the bottom drain. Yeah, that might be a clue that something's wrong. :sneaky:
p.s., I am board president of our homeowners association.

I think there is a level of perceived mathematical accuracy here, I would record these figures as 99.3%, 0.003ppm HOCl, 0.01ppm OCl- etc., and then there would also be a level of accuracy to factor in..


Are we getting there yet? The percentage (ratio) of unbound Chlorine (HOCl/OCl-).

Just to make sure we’re on the same page here, the rate of measured FC loss to UV is directly related to the concentration of OCl-. HOCl is mostly unaffected by UV degradation as is the HOCl bound to CyA. Note the term ‘mostly‘ as it is inferred in the literature that a small portion of HOCl may be affected and even a small portion of the bound HOCl. And although we believe the CyA concentration has a greater affect then pH, pH will still affect the HOCl/OCl- ratio and the amount of OCl- exposed to UV. And then there will always be a possibility that the system is influenced by something we haven’t thought of.

Those golfers and nudists would be constantly swapping clothes while standing along a common fence that keeps moving. And then we’d need to account for skin type variations, sunblock usage, ground reflection etc. etc.
 
Last edited:

Enjoying this content?

Support TFP with a donation.

Give Support
Thread Status
Hello , This thread has been inactive for over 60 days. New postings here are unlikely to be seen or responded to by other members. For better visibility, consider Starting A New Thread.