This thread presents my findings so far on pool water chemistry including the following:
Disinfecting Chlorine (HOCl) vs. Total Free Chlorine (FC) and Cyanuric Acid (CYA)
The most important finding was how little disinfecting chlorine (HOCl) is left after chlorine combines with Cyanuric Acid (CYA) to get "stored" as chlorinated cyanurates (aka cloramides). The chart at the following link shows this relationship. (I recently discovered that all forms of chlorine are measured as ppm equivalents of chlorine gas, so all charts, graphs and the spreadsheet have now been updated to reflect this.)
Note that the red in the linked chart above represents a cutoff of 0.011 ppm HOCl which roughly corresponds to the 650 mV ORP level that the U.S. and WHO set as the minimum required for disinfection. The green color is a guess at 0.05 ppm HOCl of the minimum level of chlorine needed to prevent algae. The actual number may be quite different, from 0.02 or less to 0.1 or more, but based on Ben's "Best Guess CYA Chart" which is based on real-world experience, I suspect the actual number will be somewhere in this range. So, red means bacterial growth while green means possible algae growth. Blue is the safe area.
The following shows this same data in graphical form with lines showing the same two (probably correct) "bacteria" and (totally a guess) "algae" levels.
The following is an approximate formula you can use so long as your CYA ppm is at least 5 times your FC (the formula really falls apart terribly below a ratio of CYA/FC of 3).
(HOCl as ppm Cl2) = (FC as ppm Cl2) / ( 2.7*(ppm CYA) - 4.9*(FC as ppm Cl2) + 5 )
and if you are interested in the FC for a given HOCl (to construct the equivalent of Ben's table, for example), you can use the following which just solves for ppm FC from the above.
(FC as ppm Cl2) = ( 2.7*(ppm CYA) + 5 ) / ( 4.9 + 1/(ppm HOCl) )
The constants in the above formulas are for a pH of 7.5 (which is the only parameter that significantly affects these constants). With the spreadsheet I can easily calculate the constants for other pH, but remember that the above formulas are approximate. For example, with FC of 3 and CYA of 15 the formula gives HOCl as 0.098 when the correct answer is 0.095. That's not terrible (about an 3% error). However, with FC of 5 and CYA of 15 the formula gives HOCl as 0.239 while the correct answer is 0.199 (about an 20% error) which isn't as good.
A rough rule of thumb that applies at a pH of 7.5 is that the effective chlorine level is reduced by a factor about equal to the ppm of the CYA. So, a CYA of 30 ppm reduces the disinfecting chlorine (HOCl) level to about 1/30th of what it would be with no CYA.
The inverse of the above chart may be seen at this link:
The chart columns from 0.02 to 0.1 ppm HOCl roughly correspond to "Ben's Best Guess CYA Chart". Ben's chart converted to show HOCl may be found here where you can see that the rough Min FC corresponds to 0.03 ppm, the rough Max FC corresponds to 0.07 ppm (implying an ideal target of 0.05 ppm) and the shock table is not consistent, but probably implies a minimum of 0.3 ppm, at least for green algae. User experience indicates that hard-to-kill yellow or mustard algae (and maybe black algae) may need 1.0 ppm HOCl for shock. User experience with black algae indicates that keeping active black algae from growing requires around 0.07 ppm HOCl.
A comparison of the "traditional" HOCl/OCl- graph with the same graph in the presence of CYA may be found at this post. This also shows how CYA is a "chlorine (specifically HOCl) buffer" that makes HOCl concentration about half as sensitive to changes in pH.
The original source for the equilibrium constants was done in 1973 (and published in 1974) where the recommended maximum CYA level was 25 ppm:
J. O'Brien, J. Morris and J. Butler, “Equilibria in Aqueous Solutions of Chlorinated Isocyanurateâ€, Chapter 14 in A. Rubin, ed., Chemistry of Water Supply, Treatment and Distribution, 1973 Symposium, (published 1974), Ann Arbor Science, Ann Arbor, MI, pp. 333-358.
[EDIT] A searchable PDF of this paper may be found on a link on this web page. [END-EDIT]
A Little CYA Goes A Long Way
NOTE: The mechanism of protection of chlorine from sunlight by CYA is currently under review in this post. Higher CYA levels may protect even proportionately higher levels of chlorine more, especially in deeper pools.
The following is a graph showing that a large amount of the benefit of CYA protection of chlorine from UV (sunlight) is already there at around 20 ppm. This data is approximate, not only because it is dependent on the amount of sun exposure, but because the rate constants themselves change with FC level (because there is a mix of two different rates of destruction -- one from HOCl and the other from the chlorinated cyanurates which are more stable, but still breakdown from sunlight). The limiting half-life for HOCl/OCl- is 35 minutes which is consistent with pool studies, but some experimental studies give 11.6 minutes. The limiting half-life of the chlorinated cyanurates is 8.4 hours though some other data shows it could be 6 hours.
The following graph combines the two concepts of needing more chlorine at higher CYA vs. the greater protection of chlorine by CYA. The graph shows the total chlorine (FC) loss rate in ppm/hour vs. CYA at different HOCl levels. Remember that this rate of loss will slow down as chlorine gets used up. Nevertheless, [EDIT] while in theory [END-EDIT] the absolute loss of chlorine is greater at higher CYA levels (keeping HOCl constant) and is the downside to a "high CYA & high Chlorine" approach, [EDIT] in practice there is some sort of CYA shielding effect such that higher FC and CYA levels at the same FC/CYA ratio lose less absolute amounts of chlorine (see this post later in this thread and see Mark's experiments in this post and this post [END-EDIT]. However, the primary reason to have higher CYA and Chlorine is to have a sufficient buffer of chlorine to prevent it from dropping to dangerous levels. There is obviously a tradeoff here. Though using no CYA results in the least amount of chlorine loss, the fact is that you simply can't maintain a pool with only 0.05 ppm chlorine everywhere in it -- hence a minimum level is needed as a buffer.
Salt Water chlorine Generation (SWG) pools seem to require a higher level of CYA, about 70-80 ppm, to operate efficiently. The theory is that the CYA is slow to "store" the chlorine as it is being generated so without enough CYA there is a build-up of chlorine that degrades the performance of the salt cell. I would prefer that the SWG manufacturers offer a larger lower-power (per length) cell that would work efficiently at lower CYA concentrations.
pH Rising
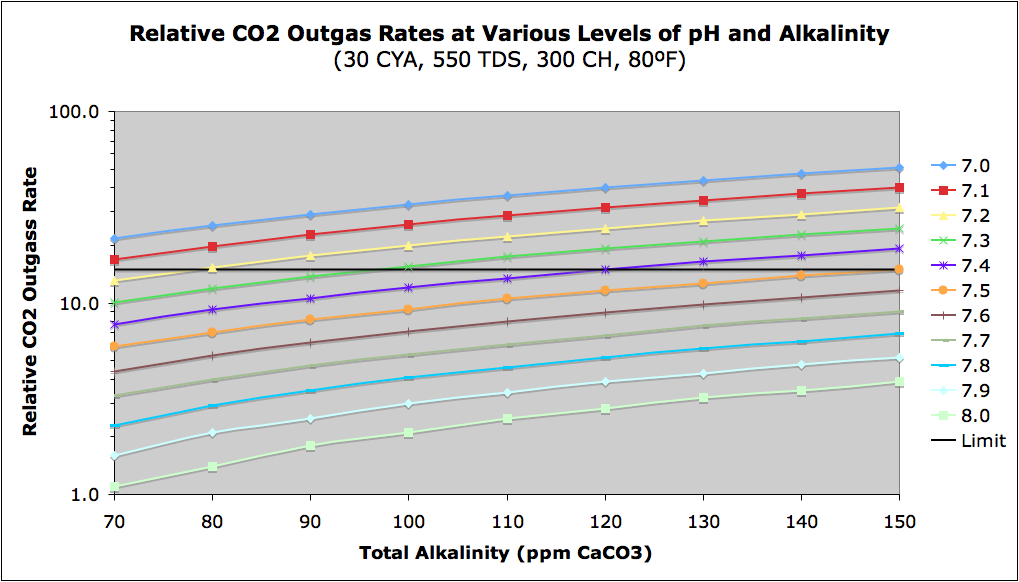
If you find that your pH wants to keep rising, this may be due to your pool outgassing CO2 to the air. The rate of outgassing increases with lower pH, higher alkalinity, and aeration of water (splashing, water fountains or slides, high wind, jets pointed up, etc.). The aeration of pool water is a physical process that will vary greatly from pool to pool, but the following chart shows the relative outgassing rate as a function of pH and Total Alkalinity. It is possible that the hydrogen gas bubble production from SWG systems contributes to significant aeration and is a source of rising pH in such SWG pools. The rate is actually a function of Carbonate Alkalinity so this chart is for a CYA of 30, but the variation with different amounts of CYA is not large. Note that there is a large variation with pH (the Y-axis is logarithmic). I have drawn a somewhat arbitrary "Limit" line at a relative rate of 15 that I have found is roughly the tolerance limit where many people start complaining about rising pH, but again aeration is a factor I cannot predict.
CO2 Chart
Spreadsheet For Detailed Calculations
The link to the spreadsheet (in a ZIP file) that calculates all of the above data is PoolEquations.zip and was last updated 14-Mar-2009. It also does some of the things that BleachCalc does, but is not for novice users.
Also see Equations for Chlorine Chemistry.
Also see Oxidation-Reduction Potential (ORP) vs. HOCl
(I will continue to edit this post to add more detail and discussion.)[/URL]
- More Accurate Calcite Saturation Index (CSI) to replace Langelier Saturation Index (LSI)
- Calculation of ppm HOCl (disinfecting chlorine) at various levels of Total Free Chlorine (FC) and Cyanuric Acid (CYA)
- Determination of pH and Alkalinity changes when adding chemicals to the pool
- Various reaction rates including chlorine breakdown by UV
Disinfecting Chlorine (HOCl) vs. Total Free Chlorine (FC) and Cyanuric Acid (CYA)
The most important finding was how little disinfecting chlorine (HOCl) is left after chlorine combines with Cyanuric Acid (CYA) to get "stored" as chlorinated cyanurates (aka cloramides). The chart at the following link shows this relationship. (I recently discovered that all forms of chlorine are measured as ppm equivalents of chlorine gas, so all charts, graphs and the spreadsheet have now been updated to reflect this.)
Note that the red in the linked chart above represents a cutoff of 0.011 ppm HOCl which roughly corresponds to the 650 mV ORP level that the U.S. and WHO set as the minimum required for disinfection. The green color is a guess at 0.05 ppm HOCl of the minimum level of chlorine needed to prevent algae. The actual number may be quite different, from 0.02 or less to 0.1 or more, but based on Ben's "Best Guess CYA Chart" which is based on real-world experience, I suspect the actual number will be somewhere in this range. So, red means bacterial growth while green means possible algae growth. Blue is the safe area.
The following shows this same data in graphical form with lines showing the same two (probably correct) "bacteria" and (totally a guess) "algae" levels.
The following is an approximate formula you can use so long as your CYA ppm is at least 5 times your FC (the formula really falls apart terribly below a ratio of CYA/FC of 3).
(HOCl as ppm Cl2) = (FC as ppm Cl2) / ( 2.7*(ppm CYA) - 4.9*(FC as ppm Cl2) + 5 )
and if you are interested in the FC for a given HOCl (to construct the equivalent of Ben's table, for example), you can use the following which just solves for ppm FC from the above.
(FC as ppm Cl2) = ( 2.7*(ppm CYA) + 5 ) / ( 4.9 + 1/(ppm HOCl) )
The constants in the above formulas are for a pH of 7.5 (which is the only parameter that significantly affects these constants). With the spreadsheet I can easily calculate the constants for other pH, but remember that the above formulas are approximate. For example, with FC of 3 and CYA of 15 the formula gives HOCl as 0.098 when the correct answer is 0.095. That's not terrible (about an 3% error). However, with FC of 5 and CYA of 15 the formula gives HOCl as 0.239 while the correct answer is 0.199 (about an 20% error) which isn't as good.
A rough rule of thumb that applies at a pH of 7.5 is that the effective chlorine level is reduced by a factor about equal to the ppm of the CYA. So, a CYA of 30 ppm reduces the disinfecting chlorine (HOCl) level to about 1/30th of what it would be with no CYA.
The inverse of the above chart may be seen at this link:
The chart columns from 0.02 to 0.1 ppm HOCl roughly correspond to "Ben's Best Guess CYA Chart". Ben's chart converted to show HOCl may be found here where you can see that the rough Min FC corresponds to 0.03 ppm, the rough Max FC corresponds to 0.07 ppm (implying an ideal target of 0.05 ppm) and the shock table is not consistent, but probably implies a minimum of 0.3 ppm, at least for green algae. User experience indicates that hard-to-kill yellow or mustard algae (and maybe black algae) may need 1.0 ppm HOCl for shock. User experience with black algae indicates that keeping active black algae from growing requires around 0.07 ppm HOCl.
A comparison of the "traditional" HOCl/OCl- graph with the same graph in the presence of CYA may be found at this post. This also shows how CYA is a "chlorine (specifically HOCl) buffer" that makes HOCl concentration about half as sensitive to changes in pH.
The original source for the equilibrium constants was done in 1973 (and published in 1974) where the recommended maximum CYA level was 25 ppm:
J. O'Brien, J. Morris and J. Butler, “Equilibria in Aqueous Solutions of Chlorinated Isocyanurateâ€, Chapter 14 in A. Rubin, ed., Chemistry of Water Supply, Treatment and Distribution, 1973 Symposium, (published 1974), Ann Arbor Science, Ann Arbor, MI, pp. 333-358.
[EDIT] A searchable PDF of this paper may be found on a link on this web page. [END-EDIT]
A Little CYA Goes A Long Way
NOTE: The mechanism of protection of chlorine from sunlight by CYA is currently under review in this post. Higher CYA levels may protect even proportionately higher levels of chlorine more, especially in deeper pools.
The following is a graph showing that a large amount of the benefit of CYA protection of chlorine from UV (sunlight) is already there at around 20 ppm. This data is approximate, not only because it is dependent on the amount of sun exposure, but because the rate constants themselves change with FC level (because there is a mix of two different rates of destruction -- one from HOCl and the other from the chlorinated cyanurates which are more stable, but still breakdown from sunlight). The limiting half-life for HOCl/OCl- is 35 minutes which is consistent with pool studies, but some experimental studies give 11.6 minutes. The limiting half-life of the chlorinated cyanurates is 8.4 hours though some other data shows it could be 6 hours.
The following graph combines the two concepts of needing more chlorine at higher CYA vs. the greater protection of chlorine by CYA. The graph shows the total chlorine (FC) loss rate in ppm/hour vs. CYA at different HOCl levels. Remember that this rate of loss will slow down as chlorine gets used up. Nevertheless, [EDIT] while in theory [END-EDIT] the absolute loss of chlorine is greater at higher CYA levels (keeping HOCl constant) and is the downside to a "high CYA & high Chlorine" approach, [EDIT] in practice there is some sort of CYA shielding effect such that higher FC and CYA levels at the same FC/CYA ratio lose less absolute amounts of chlorine (see this post later in this thread and see Mark's experiments in this post and this post [END-EDIT]. However, the primary reason to have higher CYA and Chlorine is to have a sufficient buffer of chlorine to prevent it from dropping to dangerous levels. There is obviously a tradeoff here. Though using no CYA results in the least amount of chlorine loss, the fact is that you simply can't maintain a pool with only 0.05 ppm chlorine everywhere in it -- hence a minimum level is needed as a buffer.
Salt Water chlorine Generation (SWG) pools seem to require a higher level of CYA, about 70-80 ppm, to operate efficiently. The theory is that the CYA is slow to "store" the chlorine as it is being generated so without enough CYA there is a build-up of chlorine that degrades the performance of the salt cell. I would prefer that the SWG manufacturers offer a larger lower-power (per length) cell that would work efficiently at lower CYA concentrations.
pH Rising
If you find that your pH wants to keep rising, this may be due to your pool outgassing CO2 to the air. The rate of outgassing increases with lower pH, higher alkalinity, and aeration of water (splashing, water fountains or slides, high wind, jets pointed up, etc.). The aeration of pool water is a physical process that will vary greatly from pool to pool, but the following chart shows the relative outgassing rate as a function of pH and Total Alkalinity. It is possible that the hydrogen gas bubble production from SWG systems contributes to significant aeration and is a source of rising pH in such SWG pools. The rate is actually a function of Carbonate Alkalinity so this chart is for a CYA of 30, but the variation with different amounts of CYA is not large. Note that there is a large variation with pH (the Y-axis is logarithmic). I have drawn a somewhat arbitrary "Limit" line at a relative rate of 15 that I have found is roughly the tolerance limit where many people start complaining about rising pH, but again aeration is a factor I cannot predict.
CO2 Chart
Spreadsheet For Detailed Calculations
The link to the spreadsheet (in a ZIP file) that calculates all of the above data is PoolEquations.zip and was last updated 14-Mar-2009. It also does some of the things that BleachCalc does, but is not for novice users.
Also see Equations for Chlorine Chemistry.
Also see Oxidation-Reduction Potential (ORP) vs. HOCl
(I will continue to edit this post to add more detail and discussion.)[/URL]
Last edited by a moderator: