
I made a pool logger
- Thread starter RussellC
- Start date
You are using an out of date browser. It may not display this or other websites correctly.
You should upgrade or use an alternative browser.
You should upgrade or use an alternative browser.
- Status
- Not open for further replies.
I can make the FC chart go live tomorrow probably. Any suggestions on what charts you would like to see? Individual charts? All chemicals in one graph?
I'm not sure how difficult it would be, but you could allow users to select which chemicals to graph. See 2016 Italian Grand Prix lap charts F1 Fanatic for an example of a graph allowing the user to select and de-select data ranges for a chart.
It would be cool to have a chart that takes the various parameters like today's weather, CYA level, etc into account and predicts the amount of FC loss expected over the hours following a test. I don't know the calculations but someone on here should.
Sent from my iPhone using Tapatalk
Sent from my iPhone using Tapatalk
Man that sounds tough. If there is some formula then I am sure I could do it but I wouldn't have a clue otherwise.
Yeah. There's probably formulas out there for FC loss by temp/humidity but I have no clue
Sent from my iPhone using Tapatalk
Sent from my iPhone using Tapatalk
As a salt cell user FC loss isn't as interesting to me, pH and acid consumption is more my thing. That would need an extra field to record acid dosing though...
I stuck the FC chart on a new tab in the app. It may look pretty squished in portrait mode on mobile, landscape works better. I will add the other charts when I can. Enjoy!
Just testing something. I added a function on the main page. If you click your FC number it will tell you some info and if you are in range for your CYA. The number will change colors if you are out of range. If anyone enters something like 45 for CYA it will always round up to the nearest 10 for good measure. Still thinking about the best ways to implement this for each test.


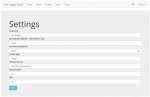
No it's fine. Have you put in all your settings in the settings screen like chlorine source etc?
")

I believe I do. Am I missing something?Do you have your pool specs in the settings page?
Attachments
- Status
- Not open for further replies.
Thread Status
Hello , This thread has been inactive for over 60 days. New postings here are unlikely to be seen or responded to by other members. For better visibility, consider Starting A New Thread.