Failing T-15 SWG Cell Experiment

Pureline is another one that advertises 2.1 lbs/day for a T-15 replacement cell. The only way to get to 2.1 lbs at a reasonable efficiency is if you assume 8 amps but that would mean, the maximum salt level of 3400 would require an 96F water temperature so the readout is at 3400 ppm. However, efficiency would need to be the same as what I measure at 70F. I doubt Pureline has better efficiency than the OEM cells.

1722963490295.png
 
Last edited:
  • Like
Reactions: JamesW
Just as a comment from experience having done a lot of metal plating in my past - even with an optimal setup you NEVER get anywhere near the ideal amount of material plated using the Nernst equation. Even in the best plating setups, you’d be lucky to start at 90% efficiency. There are many factors that affect the efficiency and, in fact, many organic additives that reduce efficiency in order to improve some other aspect like surface finish or material density. Since pool water has lots of stuff in it that doesn’t produce chlorine or oxygen, my guess is that a lot of current gets “robbed” by side reactions. And active organic molecule like cyanuric acid/cyanurate probably has some effect on electrolysis as would other organic molecules that could become polarized. Organic compounds are used as “levelers” abd “brightners” in metal plating to slow down the deposition process and reduce the chances of pit formation as well as spiking caused by non-uniform current distribution.
 
  • Wow
Reactions: JamesW
Efficiency goes up with increasing salinity levels.

In the below reference, the salinity is at 25% NaCl by mass.

Pools are kept at a substantially lower salinity.

3,200 ppm in 0.32% by mass.

At 4.3 volts per cell, there is more than enough voltage to oxidize oxide to oxygen gas.


1722971644777.png
 
Efficiency goes up with increasing salinity levels.

In the below reference, the salinity is at 25% NaCl by mass.

Pools are kept at a substantially lower salinity.

3,200 ppm in 0.32% by mass.

At 4.3 volts per cell, there is more than enough voltage to oxidize oxide to oxygen gas.


View attachment 602448

I agree with what that highlighted text is saying - these cells are driven so far beyond their equilibrium points that all kinds of undesired reactions are going to occur. Oxygen formation just being one of them.

My guess is that these cells are simply designed to be driven in such a way as to get enough chlorine gas production to be useful. If the cells also produce all other kinds of products, so be it. The manufacturers aren’t worried about efficiency or producing too much oxygen, they basically want the cell to produce as much chlorine as possible without requiring ridiculous conditions. They keep the salinity low to avoid issues of salt damage to pools and surrounding surfaces but that then requires cells to be powered outside of any efficient operating point.
 
What other reactions do you think are likely?

Haven’t really thought about it but given how impure pool water is, I can’t imagine there not being side reactions … there are oxygen-chlorine species other than hypochlorite as well.
 
  • Like
Reactions: JamesW
Water to produce hydrogen and oxygen.

6H2O→2H2+ O2 + 4OH-+ 4H+

Cathode 4H2O→ 2H2 + 4OH-
.

Anode 2H2O→O2 + 4H+.
________________________
Water and chloride to produce hydrogen and chlorine gas.

Cathode 4H2O -> 2H2 + 4OH-.

Anode 4Cl- --> 2Cl2


Anything at the anode will be an oxidation reaction.

Chloride-chlorine, oxide-oxygen-ozone, bromide-bromine, iodide-iodine, iron, carbon (algae or methane to carbon dioxide), nitrogen (ammonia to nitrogen gas), sulfide-sulfate etc.

Any oxidation will reduce chlorine demand, so it is basically equivalent to producing chlorine and then chlorine oxidizing whatever is in the water.

In a pool with sufficient chlorine, pretty much anything that can be oxidized will be oxidized by the chlorine and there will be nothing left to react at the anode.

I would think that the only significant product other than chlorine is oxygen.

You might get some current flowing through the water from plate to plate and this is lost as heat based on current (Amps) squared x resistance.

Reactions at the cathode will be reduction reactions.

Maybe some chlorine is reduced at the cathode as it makes contact?

Cl2 + 2e- --> 2Cl-

Maybe some hydrogen is oxidized at the anode?

H2 --> 2H+ + 2e-
 
Last edited:
Just my thoughts but I actually wonder how true this is. The anodes are loose plates, except for the end plates and center plate, and are held in place by a plastic cage. Given the sharp edges, I would think the flow between the plates is probably mixed at best. There’s a certain amount of electric field and current bulging that takes place at the ends of the plates due to flow. Thus I think the current distribution is a lot less uniform and non-ideal. There’s probably enough variations in cell designs out there in different products but I doubt anyone designs these cells to that level of detail.
I agree that there will be "some" mixing. However, there are some aspects to the flow within the cell which may minimize the mixing. In the middle area between plates, there is definitely turbulence under typical flow rates. However, velocity always goes to zero at a stationary boundary (i.e. the plates). Slightly off the plates, there is laminar flow (i.e. non-turbulent) and only in the middle area is there turbulent flow. But turbulent flow does not always result in macro mixing. In smooth pipes and ducts, it is generally a very localized phenomenon and the eddies tend to be very small.

I did a CFD simulation of a pair of plates with an stepped entrance to simulate the plastic holder. The inlet has a uniform velocity of 0.5 m/s along the X-axis over the entire inlet equivalent to ~35 GPM through the cell. I used two transport injection points on opposite plates near the inlet to show how particles would get carried out into the flow and mix together. Of course this is happening all over the plate surfaces but by using only two points near the inlet, it is easier to visualize.

The simulation uses a steady state RANS model implemented by OpenFoam to solve the Navier–Stokes equations. Here is some background on OpenFoam & RANS for anyone not familiar with them:


The advantage of using RANS over DNS (direct numerical simulation) is a much larger mesh size can be used at the expense of resolution (i.e. internal cell flow) but not accuracy. I used .2 mm cell spacing which resulted in over 300k cells and 3 hours of run time. Steady state solver residual convergence was better than 3E-4 so the results should be fairly accurate.


CFD Results

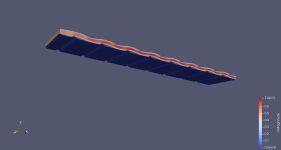
This plot shows the velocity magnitude between the cell plates. X direction is the direction of flow through the cell (150mm), Y direction is the width of the cell (62mm) and the Z direction is the gap separation between the plates (4mm).
1723038368089.png
Here is the cross-sectional velocity profile along the Z-axis at the cell X-axis mid point.
1723038385537.png
Note that the velocity goes to zero at the walls.

Here is Uz, the velocity along the Z-axis. This is the velocity component which would move the particles generated on each plate toward each other.

1723038625828.png
Most of the area is very close to zero. Only near the inlet is there an elevated Uz component. These are small eddies that occur due to the step in plate separation near the inlet.

Here is the cross sectional view of Uz at the X-axis mid point:
1723038513271.png
Note that this velocity is quite small so very little mixing would occur in this location.

Here is the same two cross sectional plots but closer to the inlet side along the X-axis.
1723039392398.png
Again, velocity goes to zero at the walls. The velocity has more of a flat top here again because of the inlet transition.

1723039405739.png
Uz is higher in this location so a bit more mixing should be expected near the inlet but tapers off away from the inlet.


Here are two plots which show the two transport injection concentrations and where mixing might occur.

X-axis mid point along Z-axis:
1723038727902.png
This would imply that the concentration ratio at each plate is weighted very heavily to the elements generate on that plate.

X-axis inlet:
1723040889058.png
The inlet is closer to the injection point which is why the concentration is much higher at the walls but even with the larger Uz velocity component, not much mixing occurs here since it is close to the injection point.

So while there is mixing going on, it just doesn't appear to be very much, especially near each plate. However, I would expect mixing to increase with the amount of scale on the plates as this would cause additional eddies to occur along the length of the plates. I believe that OpenFoam has the ability to model surface roughness so I may look into that to see how much of a difference it makes.

So in summary, I am not suggesting that the elements generated at each plate remain fully separated throughout the entire cell. I am only suggesting that perhaps the concentrations remain mostly weighted to the side of generation and therefore, PH neutralization due to mixing may not be that significant.
 
Last edited:
  • Like
Reactions: JoyfulNoise
Maybe the chlorine and hydrogen gas are reacting and the chlorine is oxidizing the hydrogen?

However, this usually requires something to initiate the reaction by breaking the chlorine into free radicals.

Cl2 --> 2Cl•

The chloride is oxidized to a chlorine radical at the anode and this pairs up with another lone chlorine atom to form chlorine gas, but maybe the radical reacts with hydrogen gas before it can pair up with another chlorine radical?

2Cl- --> 2Cl• + 2e-

2Cl• --> Cl2

I suspect that this is what initiates the explosion of built up gasses when an explosion occurs.

2Cl• + H2 --> 2H+ + 2Cl-

Cl• + H2 --> H+ + H• + Cl-

Hydrogen ions are reduced at the cathode to produce a lone monoatomic hydrogen atom with one electron (Hydrogen radical) and this pairs with another lone monoatomic hydrogen atom with one electron (Hydrogen radical) to form hydrogen gas (H2)

Maybe the lone hydrogen atoms react with the chlorine gas?

2H• + Cl2 --> 2H+ + 2Cl-

H• + Cl2 --> H+ + Cl• + Cl-

 
Last edited:
  • Like
Reactions: JoyfulNoise

Enjoying this content?

Support TFP with a donation.

Give Support
I agree that there will be "some" mixing. However, there are some aspects to the flow within the cell which may minimize the mixing. In the middle area between plates, there is definitely turbulence under typical flow rates. However, velocity always goes to zero at a stationary boundary (i.e. the plates). Slightly off the plates, there is laminar flow (i.e. non-turbulent) and only in the middle area is there turbulent flow. But turbulent flow does not always result in macro mixing. In smooth pipes and ducts, it is generally a very localized phenomenon and the eddies tend to be very small.

I did a CFD simulation of a pair of plates with an stepped entrance to simulate the plastic holder. The inlet has a uniform velocity of 0.5 m/s along the X-axis over the entire inlet equivalent to ~35 GPM through the cell. I used two transport injection points on opposite plates near the inlet to show how particles would get carried out into the flow and mix together. Of course this is happening all over the plate surfaces but by using only two points near the inlet, it is easier to visualize.

The simulation uses a steady state RANS model implemented by OpenFoam to solve the Navier–Stokes equations. Here is some background on OpenFoam & RANS for anyone not familiar with them:


The advantage of using RANS over DNS (direct numerical simulation) is a much larger mesh size can be used at the expense of resolution (i.e. internal cell flow) but not accuracy. I used .2 mm cell spacing which resulted in over 300k cells and 3 hours of run time. Steady state solver residual convergence was better than 3E-4 so the results should be fairly accurate.


CFD Results

This plot shows the velocity magnitude between the cell plates. X direction is the direction of flow through the cell (150mm), Y direction is the width of the cell (62mm) and the Z direction is the gap separation between the plates (4mm).
View attachment 602547
Here is the cross-sectional velocity profile along the Z-axis at the cell X-axis mid point.
View attachment 602548
Note that the velocity goes to zero at the walls.

Here is Uz, the velocity along the Z-axis. This is the velocity component which would move the particles generated on each plate toward each other.

View attachment 602552
Most of the area is very close to zero. Only near the inlet is there an elevated Uz component. These are small eddies that occur due to the step in plate separation near the inlet.

Here is the cross sectional view of Uz at the X-axis mid point:
View attachment 602549
Note that this velocity is quite small so very little mixing would occur in this location.

Here is the same two cross sectional plots but closer to the inlet side along the X-axis.
View attachment 602557
Again, velocity goes to zero at the walls. The velocity has more of a flat top here again because of the inlet transition.

View attachment 602558
Uz is higher in this location so a bit more mixing should be expected near the inlet but tapers off away from the inlet.


Here are two plots which show the two transport injection concentrations and where mixing might occur.

X-axis mid point along Z-axis:
View attachment 602553
This would imply that the concentration ratio at each plate is weighted very heavily to the elements generate on that plate.

X-axis inlet:
View attachment 602563
The inlet is closer to the injection point which is why the concentration is much higher at the walls but even with the larger Uz velocity component, not much mixing occurs here since it is close to the injection point.

So while there is mixing going on, it just doesn't appear to be very much, especially near each plate. However, I would expect mixing to increase with the amount of scale on the plates as this would cause additional eddies to occur along the length of the plates. I believe that OpenFoam has the ability to model surface roughness so I may look into that to see how much of a difference it makes.

So in summary, I am not suggesting that the elements generated at each plate remain fully separated throughout the entire cell. I am only suggesting that perhaps the concentrations remain mostly weighted to the side of generation and therefore, PH neutralization due to mixing may not be that significant.

This is a great analysis. I think modeling surface roughness is important because I have noticed in old cells that the plates do become fairly rough with age. Calcium scale will also cause significant roughness as it is almost never uniformly deposited on a plate.

I haven’t looked at the internal configurations of these cells in detail but it does seem like a lot of them are designed in a way that most of the water would around the outside of the cell. They seem to be designed, either intentionally or not, in a high-bypass configuration.

Thanks for adding the flow analysis, it’s very informative.
 
I haven’t looked at the internal configurations of these cells in detail but it does seem like a lot of them are designed in a way that most of the water would around the outside of the cell. They seem to be designed, either intentionally or not, in a high-bypass configuration.
I took this into account when determining the velocity through the plates. Most of the flow goes around the plates. The unobstructed free flow volume of the cell is equivalent to a ~3" diameter pipe so 36 GPM results in a velocity of around 0.5 m/sec (1.64 ft/sec).

This is a great analysis. I think modeling surface roughness is important because I have noticed in old cells that the plates do become fairly rough with age. Calcium scale will also cause significant roughness as it is almost never uniformly deposited on a plate.
I had some time to look into some of the analytical implementations of surface roughness in OpenFoam but they require fairly large cell sizes for wall function implementation which would not work for this geometry without losing a lot of resolution. So I decided to model larger scale deposits by directly modifying the plate surface CAD drawing.

The ridges are 1mm high and 3 mm wide and staggered on each plate with the intent to create as much mixing as possible. Below is the velocity plot of the flow between the plate gap. The inlet is on the left and the outlet on the right.

1723903462633.png

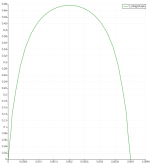
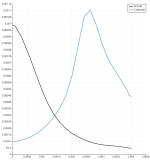
I also added more injection points along the plate. Here are the anode and cathode concentration plots (logarithmic scale):
1723903494342.png
1723903504245.png

There is more diffusion the further down the cell you look which is to be expected. At the end of the plates, there is definitely more mixing than in the smooth plate case but nothing close to100%.

1723903542117.png
The concentrations are asymmetric because the ridges are not in the same locations on both plates.


I re-ran the smooth plate case with the additional injection points for reference:

Smooth Plate Velocity plot
1723913717527.png
Smooth Plate Anode/Cathode Concentration Plots
1723913730182.png
1723913741016.png

Smooth Plate Anode/Cathode Cross-section Concentration Plot
1723913768166.png
 
Interesting flow simulations. I would have expected more mixing even out of the smoother cell.

The gasses created at the plate are often a very fine “champagne” bubble consistency. I would think that might influence the flow characteristics a bit if the bubbles remain on the plate. There’s a certain amount of surface tension to overcome before the gas bubble pulls away from the surface.

That seems like a very versatile modelling program. I’ll have to read the links you posted in more detail.
 
Interesting flow simulations. I would have expected more mixing even out of the smoother cell.

The gasses created at the plate are often a very fine “champagne” bubble consistency. I would think that might influence the flow characteristics a bit if the bubbles remain on the plate. There’s a certain amount of surface tension to overcome before the gas bubble pulls away from the surface.
I am currently using passive transport functions to represent the ions generated on the plates which by definition means they do not affect the flow of the water. However, I do agree that the gas generated could have an effect on the ion flow.

If one assumes a water flow rate between a plate pair of 0.1 L/sec & 3 amps per plate pair which should generate ~7E-4 L/sec of H2+CL2+O2 or volume ratio of 0.007. So that could have an effect on the ion flow although given the density difference, I would expect the gas movement to be dictated by the water momentum rather than visa versa.

Buoyancy is another factor as the bubbles will want to rise in the cell albeit slowly. OpenFoam can simulate multi-phase problems so there may be a way to model this.
 
The following video is a multiphase OpenFoam transient simulation with gravity in the negative Z direction and a lower velocity of 0.28 m/sec which should be about 20 GPM through the cell. I figured that was probably a minimum flow rate and it would give the bubbles time to rise although after the fact, it turned out not matter that much. I also put the cathode on bottom so H2 would rise a little faster and you will notice the gas at the top (CL2 + O2) is a bit more concentrated than the bottom (H2).


It still doesn't look like there is much mixing going on. The flows remain separated even with the ridges and bubbles. It looks like the bubbles are confining the water stream closer to the center of the plate gap and visa versa which seems to be preventing much mixing:


1724273654140.png
 
Last edited:
I would expect more turbulence.

The flow seems to be too laminar in the simulation.

Why are there bumps on the plates?

Also, some of the CL2 should be dissolving into the water before exiting the cell.
 
I would expect more turbulence.

The flow seems to be too laminar in the simulation.
Reynolds is proportional to the flow velocity and the hydraulic diameter. The hydraulic diameter for one pair of cells (4mmx62mm) is 7.5mm so with a velocity of 0.28 m/sec, the Reynolds number for the plate pair is only 1572. So yes, it is near the top of the laminar region.

I started with the low flow rate case because many people run at lower flow rates and to allow more time for the H2 to rise higher in the cell before being expelled out of the end of the cell. Plus, the lower velocity decreases run time and increases the model stability so was a good starting point for this type of analysis. To get into turbulent region, a velocity of 0.72 m/sec would be required but then there is less time in the cell as well so mixing may not be that much better but I can try it next.

The turbulence length for fully developed unobstructed pipe flow is approximately 3.8% of hydraulic diameter which for this case is 7.5 mm (4mm x 62mm duct dimensions) or turbulence length of 0.28 mm and is about 7% of the 4mm gap distance. So turbulence is fairly localized unless there is an obstruction but then, the turbulence tends to be more down stream than cross stream. So I think this is why you don't see much cross mixing.


Why are there bumps on the plates?
That was added to the simulations done in post #73 to represent scale in the cell in order see if it would increase turbulence and mixing. Plus conveniently, It is also used as an inlet for the H2/Cl2+O2 gas streams.

Also, some of the CL2 should be dissolving into the water before exiting the cell.
True but that is not captured in this analysis and doesn't really affect the outcome in terms of mixing since the two gas streams never really mix anyway.

Also, even at 0.28 m/sec, an CL2 molecule at the beginning of the cell would only spend less than a second in the cell and there is some evidence that the dissolution rate for Cl2 may be longer than that depending on conditions so Cl2 may not dissolve until it leaves the cell.
 

Attachments

  • 1724279943213.png
    1724279943213.png
    51.6 KB · Views: 0
There’s a pretty big change in solubility of chlorine gas in water with temperature -

1724294549691.png

Almost 50% less as you go from 20°C to 40°C. I know in commercial chlorine production, a lot of energy is expended keeping the electrochemical cells cooled.
 
If we assume 5 grams per liter, that is 5,000 ppm.

The actual will be about 5 ppm.

So, the amount of chlorine gas being absorbed by the water is only 1/1,000th of what the water can accept.
 

Enjoying this content?

Support TFP with a donation.

Give Support
Thread Status
Hello , This thread has been inactive for over 60 days. New postings here are unlikely to be seen or responded to by other members. For better visibility, consider Starting A New Thread.