The following gives a rough idea of pH buffering strength with 50 ppm Borates vs. 80 ppm CYA vs. 70 ppm carbonate alkalinity where the strength is buffer capacity in millimoles/liter/pH (that is, the amount of acid per volume needed to move the pH by one unit, but in an infinitesimal sense). I also list the effect of 50 ppm Borates and 80 ppm CYA on TA.
.................................................... 50 ppm ............... 80 ppm ................ 70 ppm
pH .... Borate_TA ... CYA_TA ... Borate Strength ... CYA Strength ... Carbonates Strength ... CYA+Carbonates ... CYA+Carbonates+Borate
7.0 ......... 1.7 ........... 18.8 ............. 0.08 .................... 0.32 ....................... 0.51 ......................... 0.83 ............................. 0.91
7.1 ......... 2.2 ........... 20.3 ............. 0.10 .................... 0.30 ....................... 0.41 ......................... 0.71 ............................. 0.81
7.2 ......... 2.7 ........... 21.6 ............. 0.12 .................... 0.28 ....................... 0.34 ......................... 0.62 ............................. 0.74
7.3 ......... 3.3 ........... 22.9 ............. 0.15 .................... 0.25 ....................... 0.27 ......................... 0.52 ............................. 0.67
7.4 ......... 4.1 ........... 23.9 ............. 0.19 .................... 0.22 ....................... 0.23 ......................... 0.45 ............................. 0.64
7.5 ......... 5.2 ........... 24.9 ............. 0.23 .................... 0.20 ....................... 0.18 ......................... 0.38 ............................. 0.61
7.6 ......... 6.5 ........... 25.6 ............. 0.29 .................... 0.17 ....................... 0.15 ......................... 0.32 ............................. 0.61
7.7 ......... 8.1 ........... 26.3 ............. 0.36 .................... 0.14 ....................... 0.13 ......................... 0.27 ............................. 0.63
7.8 ....... 10.0 ........... 26.8 ............. 0.44 .................... 0.12 ....................... 0.11 ......................... 0.23 ............................. 0.67
7.9 ....... 12.5 ........... 27.2 ............. 0.54 .................... 0.10 ....................... 0.09 ......................... 0.19 ............................. 0.73
8.0 ....... 15.5 ........... 27.6 ............. 0.67 .................... 0.09 ....................... 0.08 ......................... 0.17 ............................. 0.84
You can see not only how 50 ppm Borates increases pH buffering overall, but is a nice complement to the carbonates and CYA pH buffering and provides stronger buffering as the pH rises. So basically you have the carbonates and CYA preventing the pH from quickly dropping too much while you have the borates preventing it from quickly rising too much. Additional info is in this post.
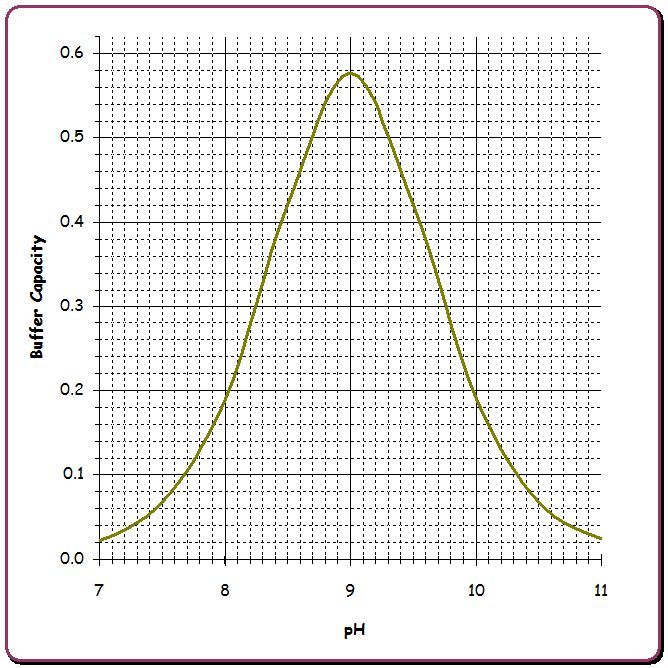
The peak pH buffering occurs when the pH is at the pKa of the weak acid and its conjugate base so for carbonic acid / bicarbonate this is at pH 6.3, for bicarbonate / carbonate this is at pH 10.2 while for H3CY/H2CY- this is at pH 6.8, for H2CY-/HCY2- this is at pH 11.3, for HCY2-/CY3- this is at pH 13.3, for boric acid / borate ion this is at pH 9.1.
As noted in this link, the buffer capacity can be calculated from the formula ln(10)*Cbuf*Ka*[H+]/(Ka+[H+])2 and the amount of acid or base needed to change the pH by a specific amount can be calculated by the difference in Cbuf*Ka/(Ka+[H+]) at two different pH values and summing these differences for all of the buffer species. Calculating the effect on pH when acid or base is added when multiple buffer species are present requires iteration since the inverse formula cannot be solved in closed form.
.................................................... 50 ppm ............... 80 ppm ................ 70 ppm
pH .... Borate_TA ... CYA_TA ... Borate Strength ... CYA Strength ... Carbonates Strength ... CYA+Carbonates ... CYA+Carbonates+Borate
7.0 ......... 1.7 ........... 18.8 ............. 0.08 .................... 0.32 ....................... 0.51 ......................... 0.83 ............................. 0.91
7.1 ......... 2.2 ........... 20.3 ............. 0.10 .................... 0.30 ....................... 0.41 ......................... 0.71 ............................. 0.81
7.2 ......... 2.7 ........... 21.6 ............. 0.12 .................... 0.28 ....................... 0.34 ......................... 0.62 ............................. 0.74
7.3 ......... 3.3 ........... 22.9 ............. 0.15 .................... 0.25 ....................... 0.27 ......................... 0.52 ............................. 0.67
7.4 ......... 4.1 ........... 23.9 ............. 0.19 .................... 0.22 ....................... 0.23 ......................... 0.45 ............................. 0.64
7.5 ......... 5.2 ........... 24.9 ............. 0.23 .................... 0.20 ....................... 0.18 ......................... 0.38 ............................. 0.61
7.6 ......... 6.5 ........... 25.6 ............. 0.29 .................... 0.17 ....................... 0.15 ......................... 0.32 ............................. 0.61
7.7 ......... 8.1 ........... 26.3 ............. 0.36 .................... 0.14 ....................... 0.13 ......................... 0.27 ............................. 0.63
7.8 ....... 10.0 ........... 26.8 ............. 0.44 .................... 0.12 ....................... 0.11 ......................... 0.23 ............................. 0.67
7.9 ....... 12.5 ........... 27.2 ............. 0.54 .................... 0.10 ....................... 0.09 ......................... 0.19 ............................. 0.73
8.0 ....... 15.5 ........... 27.6 ............. 0.67 .................... 0.09 ....................... 0.08 ......................... 0.17 ............................. 0.84
You can see not only how 50 ppm Borates increases pH buffering overall, but is a nice complement to the carbonates and CYA pH buffering and provides stronger buffering as the pH rises. So basically you have the carbonates and CYA preventing the pH from quickly dropping too much while you have the borates preventing it from quickly rising too much. Additional info is in this post.
The peak pH buffering occurs when the pH is at the pKa of the weak acid and its conjugate base so for carbonic acid / bicarbonate this is at pH 6.3, for bicarbonate / carbonate this is at pH 10.2 while for H3CY/H2CY- this is at pH 6.8, for H2CY-/HCY2- this is at pH 11.3, for HCY2-/CY3- this is at pH 13.3, for boric acid / borate ion this is at pH 9.1.
As noted in this link, the buffer capacity can be calculated from the formula ln(10)*Cbuf*Ka*[H+]/(Ka+[H+])2 and the amount of acid or base needed to change the pH by a specific amount can be calculated by the difference in Cbuf*Ka/(Ka+[H+]) at two different pH values and summing these differences for all of the buffer species. Calculating the effect on pH when acid or base is added when multiple buffer species are present requires iteration since the inverse formula cannot be solved in closed form.